Frontier Airlines 2010 Annual Report Download - page 80
Download and view the complete annual report
Please find page 80 of the 2010 Frontier Airlines annual report below. You can navigate through the pages in the report by either clicking on the pages listed below, or by using the keyword search tool below to find specific information within the annual report.-
 1
1 -
2
-
3
-
4
-
5
-
6
-
7
-
8
-
9
-
10
-
11
-
12
-
13
-
14
-
15
-
16
-
17
-
18
-
19
-
20
-
21
-
22
-
23
-
24
-
25
-
26
-
27
-
28
-
29
-
30
-
31
-
32
-
33
-
34
-
35
-
36
-
37
-
38
-
39
-
40
-
41
-
42
-
43
-
44
-
45
-
46
-
47
-
48
-
49
-
50
-
51
-
52
-
53
-
54
-
55
-
56
-
57
-
58
-
59
-
60
-
61
-
62
-
63
-
64
-
65
-
66
-
67
-
68
-
69
-
 70
70 -
 71
71 -
 72
72 -
 73
73 -
 74
74 -
 75
75 -
 76
76 -
 77
77 -
 78
78 -
 79
79 -
 80
80 -
 81
81 -
 82
82 -
 83
83 -
 84
84 -
 85
85 -
 86
86 -
 87
87 -
 88
88 -
 89
89 -
 90
90 -
91
-
92
-
93
-
94
-
95
-
96
-
97
-
98
-
99
-
100
-
101
-
102
-
103
-
104
-
105
-
106
-
107
-
108
-
109
-
110
-
111
-
112
-
113
-
114
-
115
-
116
-
117
-
118
-
119
-
120
-
121
-
122
-
123
-
124
-
125
-
126
-
127
-
128
-
129
-
130
-
131
-
132
-
133
-
134
-
135
-
136
-
137
-
138
-
139
-
140
-
141
-
142
-
143
-
144
-
145
-
146
-
147
-
148
-
149
-
150
-
151
-
152
-
153
-
154
-
155
-
156
-
157
-
158
-
159
-
160
-
161
-
162
-
163
-
164
-
165
-
166
-
167
-
168
-
169
 |
 |

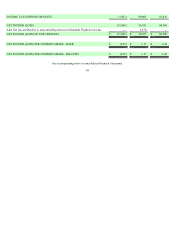
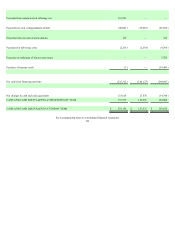
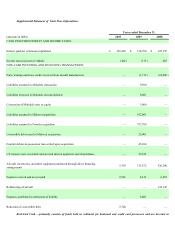
Proceeds from common stock offerings, net 101,926
—
—
Payments on early extinguishment of debt (60,045 ) (70,887 ) (49,969 )
Proceeds from exercise of stock options 129
—
325
Payments for debt issue costs (2,216 ) (2,654 ) (4,564 )
Proceeds on settlement of interest rate swaps
—
—
5,785
Purchase of treasury stock (7 )
—
(39,409 )
Net cash from financing activities (125,312 ) (144,127 ) (194,697 )
Net changes in cash and cash equivalents 133,618 27,876 (34,348 )
CASH AND CASH EQUIVALENTS AT BEGINNING OF YEAR 157,532 129,656 164,004
CASH AND CASH EQUIVALENTS AT END OF YEAR $291,150
$ 157,532 $129,656
See accompanying notes to consolidated financial statements.
50