Frontier Airlines 2010 Annual Report Download - page 68
Download and view the complete annual report
Please find page 68 of the 2010 Frontier Airlines annual report below. You can navigate through the pages in the report by either clicking on the pages listed below, or by using the keyword search tool below to find specific information within the annual report.-
 1
1 -
2
-
3
-
4
-
5
-
6
-
7
-
8
-
9
-
10
-
11
-
12
-
13
-
14
-
15
-
16
-
17
-
18
-
19
-
20
-
21
-
22
-
23
-
24
-
25
-
26
-
27
-
28
-
29
-
30
-
31
-
32
-
33
-
34
-
35
-
36
-
37
-
38
-
39
-
40
-
41
-
42
-
43
-
44
-
45
-
46
-
47
-
48
-
49
-
50
-
51
-
52
-
53
-
54
-
55
-
56
-
57
-
 58
58 -
 59
59 -
 60
60 -
 61
61 -
 62
62 -
 63
63 -
 64
64 -
 65
65 -
 66
66 -
 67
67 -
 68
68 -
 69
69 -
 70
70 -
 71
71 -
 72
72 -
 73
73 -
 74
74 -
 75
75 -
 76
76 -
 77
77 -
 78
78 -
79
-
80
-
81
-
82
-
83
-
84
-
85
-
86
-
87
-
88
-
89
-
90
-
91
-
92
-
93
-
94
-
95
-
96
-
97
-
98
-
99
-
100
-
101
-
102
-
103
-
104
-
105
-
106
-
107
-
108
-
109
-
110
-
111
-
112
-
113
-
114
-
115
-
116
-
117
-
118
-
119
-
120
-
121
-
122
-
123
-
124
-
125
-
126
-
127
-
128
-
129
-
130
-
131
-
132
-
133
-
134
-
135
-
136
-
137
-
138
-
139
-
140
-
141
-
142
-
143
-
144
-
145
-
146
-
147
-
148
-
149
-
150
-
151
-
152
-
153
-
154
-
155
-
156
-
157
-
158
-
159
-
160
-
161
-
162
-
163
-
164
-
165
-
166
-
167
-
168
-
169
 |
 |

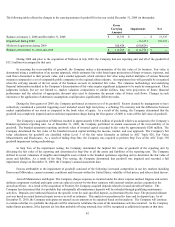
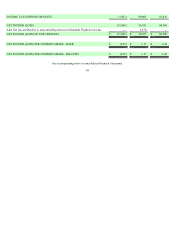
Income Taxes. The Company has generated significant net operating losses (“NOLs”) for federal income tax purposes primarily
from accelerated depreciation on owned aircraft. Certain of our NOLs generated prior to July 2005 and acquired from Midwest and Frontier
are subject to an annual limitation under Internal Revenue Code Section 382 (“IRC 382”). The annual limitation is based upon the enterprise
value of the Company on the IRC 382 ownership change date multiplied by the applicable long-term tax exempt rate. If the utilization of
deferred tax asset, and other carry forwards becomes uncertain in future years, we will be required to record a valuation allowance for the
deferred tax assets not expected to be utilized.
Intangible Assets - Commuter Slots. The Company acquired commuter slots during 2005 at the New York-LaGuardia and Ronald
Reagan Washington National airports from US Airways. The licensing agreement with the Company and US Airways for the LaGuardia
commuter slots expired on December 31, 2006, but we maintain a security interest in the LaGuardia slots if US Airways fails to perform
under the current licensing agreement. The estimated useful lives of these commuter slots were determined based upon the period of time
cash flows are expected to be generated by the commuter slots and by researching the estimated useful lives of commuter slots or similar
intangibles by other airlines. In addition, an estimated residual value was determined using estimates of the expected fair value of the
commuter slots at the end of the expected useful life. The residual value will be assessed annually for impairment. The estimated useful lives
are also reviewed annually.
As a result of the acquisitions of Frontier and Midwest during the year ended December 31, 2009, the Company acquired slots at the
New York, LaGuardia, Ronald Reagan Washington National and Newark Liberty International airports. Management concluded these slots
were indefinite lived assets given the nature of the assets and existing and pending legislation regarding slots at the aforementioned airports.
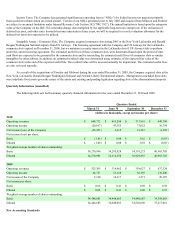
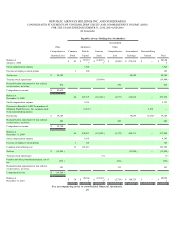
Quarterly Information (unaudited)
The following table sets forth summary quarterly financial information for the years ended December 31, 2010 and 2009.
Quarters Ended
March 31 June 30 September 30 December 31
(dollars in thousands, except net income per share)
2010
Operating revenues $608,712 $ 683,284 $ 711,865 $ 649,790
Operating income (20,017 ) 43,555 73,022 36,794
Net income (loss) of the Company (36,459 ) 2,615 21,287 (1,289 )
Net income (loss) per share:
Basic $(1.06 ) $ 0.08 $ 0.62 $ (0.03 )
Diluted $(1.06 ) $ 0.08 $ 0.58 $ (0.03 )
Weighted average number of shares outstanding:
Basic 34,270,996 34,295,028 34,318,275 40,965,705
Diluted 34,270,996 34,314,350 36,929,893 40,965,705
2009
Operating revenues $325,305 $ 319,962 $ 359,627 $ 637,324
Operating income 44,767 53,638 36,595 136,400
Net income of the Company 2,160 14,117 3,271 20,107
Net income per share:
Basic $0.06 $ 0.41 $ 0.09 $ 0.58
Diluted $0.06 $ 0.41 $ 0.09 $ 0.55
Weighted average number of shares outstanding:
Basic 34,448,683 34,448,683 34,448,683 34,598,683
Diluted 34,448,683 34,448,683 34,528,690 37,217,661
New Accounting Standards