Frontier Airlines 2010 Annual Report Download - page 57
Download and view the complete annual report
Please find page 57 of the 2010 Frontier Airlines annual report below. You can navigate through the pages in the report by either clicking on the pages listed below, or by using the keyword search tool below to find specific information within the annual report.-
 1
1 -
2
-
3
-
4
-
5
-
6
-
7
-
8
-
9
-
10
-
11
-
12
-
13
-
14
-
15
-
16
-
17
-
18
-
19
-
20
-
21
-
22
-
23
-
24
-
25
-
26
-
27
-
28
-
29
-
30
-
31
-
32
-
33
-
34
-
35
-
36
-
37
-
38
-
39
-
40
-
41
-
42
-
43
-
44
-
45
-
46
-
 47
47 -
 48
48 -
 49
49 -
 50
50 -
 51
51 -
 52
52 -
 53
53 -
 54
54 -
 55
55 -
 56
56 -
 57
57 -
 58
58 -
 59
59 -
 60
60 -
 61
61 -
 62
62 -
 63
63 -
 64
64 -
 65
65 -
 66
66 -
 67
67 -
68
-
69
-
70
-
71
-
72
-
73
-
74
-
75
-
76
-
77
-
78
-
79
-
80
-
81
-
82
-
83
-
84
-
85
-
86
-
87
-
88
-
89
-
90
-
91
-
92
-
93
-
94
-
95
-
96
-
97
-
98
-
99
-
100
-
101
-
102
-
103
-
104
-
105
-
106
-
107
-
108
-
109
-
110
-
111
-
112
-
113
-
114
-
115
-
116
-
117
-
118
-
119
-
120
-
121
-
122
-
123
-
124
-
125
-
126
-
127
-
128
-
129
-
130
-
131
-
132
-
133
-
134
-
135
-
136
-
137
-
138
-
139
-
140
-
141
-
142
-
143
-
144
-
145
-
146
-
147
-
148
-
149
-
150
-
151
-
152
-
153
-
154
-
155
-
156
-
157
-
158
-
159
-
160
-
161
-
162
-
163
-
164
-
165
-
166
-
167
-
168
-
169
 |
 |
Aircraft fuel expense decreased 27.8%, or $91.2 million, to $236.6 million for 2009 compared to $327.8 million for
2008. Beginning in May 2009 and June 2009, we did not record fuel expense and the related revenue for the American and Delta operations,
respectively. We also did not pay for or record fuel expense and the related revenue for Continental or US Airways operations. United has
continued to increase the portion of flying for which they pay directly. These decreases were partially offset by fuel expense of $144.9
million related to Midwest and Frontier operations. The cost per gallon for fuel used in the branded operation was $2.15 in 2009. The unit
cost decreased to 1.38¢ in 2009 compared to 2.48¢ in 2008.
Landing fees and airport rents increased by 61.8%, or $37.0 million, to $96.9 million in 2009 compared to $59.9 million in
2008. This was due to the acquisition of Frontier and Midwest during the year, which accounted for $34.3 million of additional expense in
2009. Our fixed-fee agreements provide for a direct reimbursement of landing fees. The unit cost was 0.57¢ in 2009 compared to 0.45¢ in
2008.
Aircraft and engine rent increased by 16.8%, or $22.6 million, to $156.8 million in 2009 compared to $134.2 million in
2008. Midwest and Frontier accounted for additional expense of $37.7 million. This was partially offset by a decrease in rents on the CRJ
aircraft of $15.1 million. The unit cost decreased to 0.92¢ for 2009 compared to 1.02¢ for 2008.
Maintenance and repair expenses increased by 24.8%, or $42.1 million, to $211.5 million in 2009 compared to $169.4 million for
2008 due mainly to the acquisition of Midwest and Frontier and engine limited life parts for the fixed-fee small jets. Midwest and Frontier
maintenance expenses for the year were $24.2 million. The fixed-fee maintenance expenses increased for the large jets due mainly to a 17%
increase in block hours, or a $31.5 million increase in expense, offset by a decrease in small jet expenses of $4.5 million that includes $11.7
million of engine limited life parts. The unit cost decreased to 1.24¢ in 2009 compared to 1.28¢ in 2008.
Insurance and taxes increased 9.0%, or $2.3 million, to $28.1 million in 2009 compared to $25.8 million in 2008. Midwest and
Frontier expenses are $6.3 million, which is offset by decreases on the fixed-fee operations for property taxes of $3.1 million and liability
insurance of $0.6 million. Our fixed-fee agreements generally provide for a direct reimbursement of insurance and property taxes. The unit
cost decreased to 0.16¢ in 2009 compared to 0.20¢ in 2008.
Depreciation and amortization increased 22.8%, or $30.4 million, to $163.6 million in 2009 compared to $133.2 million in 2008 due
mainly to $22.1 million of depreciation from Midwest and Frontier. Additionally, depreciation on EJet aircraft increased on aircraft
purchased during 2008 and 2009. The unit cost decreased to 0.96¢ in 2009 compared to 1.01¢ in 2008.
Promotion and sales expenses of $36.3 million were included as a result of the acquisitions of Midwest, Mokulele, and Frontier to
our branded services. All of these expenses relate to the branded operations only. The unit cost was 0.21¢ in 2009.
Goodwill impairment and other impairment charges of $122.6 million in 2009 is primarily a result of goodwill impairment during
the first quarter from the fixed-fee services as well as goodwill impairment during the fourth quarter that was generated from the acquisition
of Midwest. The unit cost was 0.71¢ in 2009.
The gain on bargain purchase of $203.7 million is related to the acquisition of Frontier. The unit benefit was 1.19¢.
Other expenses increased 47.4%, or $57.8 million, to $179.8 million in 2009 from $122.0 million in 2008. Of the increase, $58.0
million related to expenses from Frontier and Midwest. The unit cost increased to 1.05¢ in 2009 compared to 0.92¢ in 2008.
Interest expense increased 10.0% or $13.1 million, to $145.0 million in 2009 from $131.9 million in 2008 primarily due to $12.6
million of expense from Midwest and Frontier. The unit cost decreased to 0.85¢ in 2009 compared to 1.00¢ in 2008.
We incurred income tax expense of $99.8 million during 2009, compared to $52.8 million in 2008. The effective tax rates for 2009
and 2008 were 73.3% and 38.4%, respectively, which were higher than the statutory rate due primarily to the non-deductible goodwill
impairment in 2009 and state income taxes and non-deductible meals and entertainment expense, primarily for our flight crews in 2009 and
2008.
Liquidity and Capital Resources
2010 compared to 2009
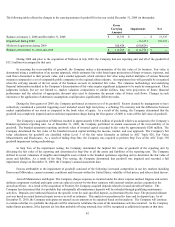
As of December 31, 2010, we had total cash of $430.3 million of which $291.2 million was unrestricted. At December 31, 2010, we
had a working capital deficit of $59.5 million. The Company currently anticipates that its unrestricted cash on hand, the cash generated from
operations, and other financings will be sufficient to meet its anticipated working capital and capital expenditure requirements for at least the