Frontier Airlines 2010 Annual Report Download - page 55
Download and view the complete annual report
Please find page 55 of the 2010 Frontier Airlines annual report below. You can navigate through the pages in the report by either clicking on the pages listed below, or by using the keyword search tool below to find specific information within the annual report.-
 1
1 -
2
-
3
-
4
-
5
-
6
-
7
-
8
-
9
-
10
-
11
-
12
-
13
-
14
-
15
-
16
-
17
-
18
-
19
-
20
-
21
-
22
-
23
-
24
-
25
-
26
-
27
-
28
-
29
-
30
-
31
-
32
-
33
-
34
-
35
-
36
-
37
-
38
-
39
-
40
-
41
-
42
-
43
-
44
-
 45
45 -
 46
46 -
 47
47 -
 48
48 -
 49
49 -
 50
50 -
 51
51 -
 52
52 -
 53
53 -
 54
54 -
 55
55 -
 56
56 -
 57
57 -
 58
58 -
 59
59 -
 60
60 -
 61
61 -
 62
62 -
 63
63 -
 64
64 -
 65
65 -
66
-
67
-
68
-
69
-
70
-
71
-
72
-
73
-
74
-
75
-
76
-
77
-
78
-
79
-
80
-
81
-
82
-
83
-
84
-
85
-
86
-
87
-
88
-
89
-
90
-
91
-
92
-
93
-
94
-
95
-
96
-
97
-
98
-
99
-
100
-
101
-
102
-
103
-
104
-
105
-
106
-
107
-
108
-
109
-
110
-
111
-
112
-
113
-
114
-
115
-
116
-
117
-
118
-
119
-
120
-
121
-
122
-
123
-
124
-
125
-
126
-
127
-
128
-
129
-
130
-
131
-
132
-
133
-
134
-
135
-
136
-
137
-
138
-
139
-
140
-
141
-
142
-
143
-
144
-
145
-
146
-
147
-
148
-
149
-
150
-
151
-
152
-
153
-
154
-
155
-
156
-
157
-
158
-
159
-
160
-
161
-
162
-
163
-
164
-
165
-
166
-
167
-
168
-
169
 |
 |
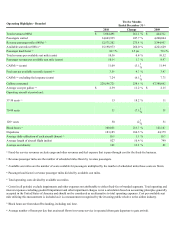
Landing fees and airport rents increased by 76.1%, or $73.8 million, to $170.7 million in 2010 compared to $96.9 million in 2009.
Increases for our branded operations accounted for $84.6 million of additional expense in 2010. Beginning in May 2009 we did not record
landing fees and the related revenue for Delta operations. The remainder of our fixed-fee agreements provide for a direct reimbursement of
landing fees. The unit cost was 0.64¢ in 2010 compared to 0.57¢ in 2009.
Aircraft and engine rent increased by 53.4%, or $83.8 million, to $240.6 million in 2010 compared to $156.8 million in 2009.
Frontier accounted for additional expense of $83.3 million in 2010 compared to 2009. The unit cost decreased to 0.91¢ for 2010 compared to
0.92¢ for 2009.
Maintenance and repair expenses increased by 20.9%, or $44.3 million, to $255.8 million in 2010 compared to $211.5 million for
2009. Frontier maintenance expenses increased $35.5 million. Maintenance expenses increased for the regional jets due mainly to the aging
of the fleet and an increase in operations. The unit cost decreased to 0.96¢ in 2010 compared to 1.24¢ in 2009.
Insurance and taxes increased 62.0%, or $17.4 million, to $45.5 million in 2010 compared to $28.1 million in 2009. Frontier
expenses increased $11.2 million. Our fixed-fee agreements generally provide for a direct reimbursement of insurance and property
taxes. The unit cost increased to 0.17¢ in 2010 compared to 0.16¢ in 2009.
Depreciation and amortization increased 25.0%, or $40.9 million, to $204.5 million in 2010 compared to $163.6 million in 2009 due
mainly to an increase of $28.9 million of depreciation at Frontier. Additionally, depreciation on EJet aircraft increased for aircraft purchased
during 2009 and 2010. The unit cost decreased to 0.77¢ in 2010 compared to 0.96¢ in 2009.
Promotion and sales expenses increased 271.7%, or $98.5 million, to $134.8 million in 2010 compared to $36.3 million in 2009 due
mainly to the acquisition of Frontier in 2009. These expenses relate to our branded operations only. The unit cost increased to 0.51¢ in 2010
compared to 0.21¢ in 2009.
Other impairment charges increased $2.7 million, to $11.5 million in 2010 compared to $8.8 million in 2009 due mainly to
additional impairments taken on the Midwest trade name in 2010. The unit cost decreased to 0.04¢ in 2010 compared to 0.05¢ in 2009.
Other expenses increased 61.3%, or $110.3 million, to $290.1 million in 2010 from $179.8 million in 2009. Frontier other expenses
increased $126.5 million. In 2009, we incurred approximately $13.0 million of aircraft transition costs and charges related to Mokulele. The
unit cost increased to 1.10¢ in 2010 compared to 1.05¢ in 2009.
Interest expense increased 4.6% or $6.7 million, to $151.7 million in 2010 from $145.0 million in 2009 primarily due to $5.6 million
increase in expense at Frontier. The unit cost decreased to 0.57¢ in 2010 compared to 0.85¢ in 2009.
We incurred an income tax benefit of $7.7 million during 2010, compared to income tax expense of $99.8 million in 2009. The
effective tax rates for 2010 and 2009 were 35.7% and 73.3%, respectively. In 2009, the rate was higher than the statutory rate due primarily
to non-deductible goodwill impairments. In 2010, the rate was higher than the statutory rate due primarily to state income taxes.
2009 Compared to 2008
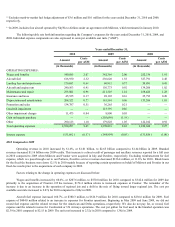
Operating revenue in 2009 increased by 11%, or $162.5 million, to $1.64 billion compared to $1.48 billion in 2008. Excluding
reimbursement for fuel expense, which is a pass-through cost to our Partners, fixed-fee service revenues decreased 4.1% for 2009. Block
hour production for the fixed-fee business was down 8.9% in 2009 because of the reduction of aircraft operated for Continental. Also, the
aircraft operations for Midwest are reported as branded flying beginning in August 2009. Branded revenues were $444.3 million, which
represented passenger and ancillary revenues on our Midwest operations beginning in August 2009, Frontier operations beginning in October
2009, and Mokulele operations between April and October 2009.
Total operating and interest expenses, excluding fuel, goodwill impairment, and other impairment charges increased $331.6 million,
to $1.36 billion for 2009 compared to $1.03 billion during 2008 due to the acquisitions of Midwest and Frontier. The cost per available seat
mile on total operating and interest expenses, excluding fuel charges, increased to 7.95¢ in 2009 compared to 7.79¢ in 2008. Factors relating
to the change in operating expenses are discussed below.
Wages and benefits increased by 35.7%, or $90.1 million, to $342.4 million for 2009 compared to $252.3 million for 2008 due
primarily to the acquisition of Midwest and Frontier. Of the increase, $86.0 million relates to expenses at Midwest and Frontier. The cost
per available seat mile increased to 2.00¢ for 2009 compared to 1.91¢ in 2008.