Frontier Airlines 2010 Annual Report Download - page 53
Download and view the complete annual report
Please find page 53 of the 2010 Frontier Airlines annual report below. You can navigate through the pages in the report by either clicking on the pages listed below, or by using the keyword search tool below to find specific information within the annual report.-
 1
1 -
2
-
3
-
4
-
5
-
6
-
7
-
8
-
9
-
10
-
11
-
12
-
13
-
14
-
15
-
16
-
17
-
18
-
19
-
20
-
21
-
22
-
23
-
24
-
25
-
26
-
27
-
28
-
29
-
30
-
31
-
32
-
33
-
34
-
35
-
36
-
37
-
38
-
39
-
40
-
41
-
42
-
 43
43 -
 44
44 -
 45
45 -
 46
46 -
 47
47 -
 48
48 -
 49
49 -
 50
50 -
 51
51 -
 52
52 -
 53
53 -
 54
54 -
 55
55 -
 56
56 -
 57
57 -
 58
58 -
 59
59 -
 60
60 -
 61
61 -
 62
62 -
 63
63 -
64
-
65
-
66
-
67
-
68
-
69
-
70
-
71
-
72
-
73
-
74
-
75
-
76
-
77
-
78
-
79
-
80
-
81
-
82
-
83
-
84
-
85
-
86
-
87
-
88
-
89
-
90
-
91
-
92
-
93
-
94
-
95
-
96
-
97
-
98
-
99
-
100
-
101
-
102
-
103
-
104
-
105
-
106
-
107
-
108
-
109
-
110
-
111
-
112
-
113
-
114
-
115
-
116
-
117
-
118
-
119
-
120
-
121
-
122
-
123
-
124
-
125
-
126
-
127
-
128
-
129
-
130
-
131
-
132
-
133
-
134
-
135
-
136
-
137
-
138
-
139
-
140
-
141
-
142
-
143
-
144
-
145
-
146
-
147
-
148
-
149
-
150
-
151
-
152
-
153
-
154
-
155
-
156
-
157
-
158
-
159
-
160
-
161
-
162
-
163
-
164
-
165
-
166
-
167
-
168
-
169
 |
 |

(10) Excludes mark-to-market fuel hedge adjustment of $3.6 million and $0.1 million for the years ended December 31, 2010 and 2009,
respectively.
(11) In 2009, includes four aircraft operated by SkyWest Airlines under an agreement with Midwest, which terminated in January 2010.
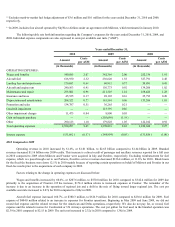
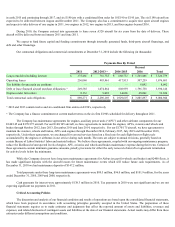
The following table sets forth information regarding the Company’ s expenses for the years ended December 31, 2010, 2009, and
2008. Individual expense components are also expressed in cents per available seat mile (“ASM”).
Years ended December 31,
2010 2009 2008
Amount Cents
per ASM Amount Cents
per ASM Amount Cents
per ASM
(in thousands) (in thousands) (in thousands)
OPERATING EXPENSES:
Wages and benefits 549,889 2.07 342,364 2.00 252,336 1.91
Aircraft fuel 616,930 2.32 236,620 1.38 327,791 2.48
Landing fees and airport rents 170,683 0.64 96,915 0.57 59,891 0.45
Aircraft and engine rent 240,563 0.91 156,773 0.92 134,206 1.02
Maintenance and repair 255,802 0.96 211,503 1.24 169,425 1.28
Insurance and taxes 45,525 0.17 28,105 0.16 25,793 0.20
Depreciation and amortization 204,522 0.77 163,584 0.96 133,206 1.01
Promotion and sales 134,787 0.51 36,265 0.21
—
—
Goodwill impairment
—
—
113,759 0.66
—
—
Other impairment charges 11,473 0.04 8,800 0.05
—
—
Gain on bargain purchase
—
—
(203,698 ) (1.19 )
—
—
Other 290,123 1.10 179,828 1.05 122,012 0.92
Total operating expenses 2,520,297 9.49 1,370,818 8.01 1,224,660 9.27
Interest expense (151,662 ) (0.57 ) (144,994 ) (0.85 ) (131,856 ) (1.00 )
2010 Compared to 2009
Operating revenue in 2010 increased by 61.6%, or $1.01 billion, to $2.65 billion compared to $1.64 billion in 2009. Branded
revenues increased $1.16 billion over 2009 results. This increase is a direct result of passenger and ancillary revenues reported for a full year
in 2010 compared to 2009 when Midwest and Frontier were acquired in July and October, respectively. Excluding reimbursement for fuel
expense, which is a pass-through cost to our Partners, fixed-fee service revenues decreased $126.4 million, or 11.6% for 2010. Block hours
for the fixed-fee business were down 12.1% in 2010 mainly because of reporting certain operations on behalf of Midwest and Frontier in our
fixed-fee results prior to the acquisitions of each company in 2009.
Factors relating to the change in operating expenses are discussed below:
Wages and benefits increased by 60.6%, or $207.6 million, to $550.0 million for 2010 compared to $342.4 million for 2009 due
primarily to the acquisition of Frontier. Of the increase, $174.4 million relates to increased expenses at Frontier. The remainder of the
increase is due to an increase in the operation of regional jets and a shift in the mix of flying toward larger regional jets. The cost per
available seat mile increased to 2.07¢ for 2010 compared to 2.00¢ in 2009.
Aircraft fuel expense increased 160.7%, or $380.3 million, to $616.9 million for 2010 compared to $236.6 million for 2009. Fuel
expense of $404.0 million related to an increase in expenses for Frontier operations. Beginning in May 2009 and June 2009, we did not
record fuel expense and the related revenue for the American and Delta operations, respectively. We also do not pay for, or record, fuel
expense and the related revenue for Continental or US Airways operations. The cost per gallon for fuel used in the branded operation was
$2.39 in 2010 compared to $2.15 in 2009. The unit cost increased to 2.32¢ in 2010 compared to 1.38¢ in 2009.