Frontier Airlines 2010 Annual Report Download - page 43
Download and view the complete annual report
Please find page 43 of the 2010 Frontier Airlines annual report below. You can navigate through the pages in the report by either clicking on the pages listed below, or by using the keyword search tool below to find specific information within the annual report.-
 1
1 -
2
-
3
-
4
-
5
-
6
-
7
-
8
-
9
-
10
-
11
-
12
-
13
-
14
-
15
-
16
-
17
-
18
-
19
-
20
-
21
-
22
-
23
-
24
-
25
-
26
-
27
-
28
-
29
-
30
-
31
-
32
-
 33
33 -
 34
34 -
 35
35 -
 36
36 -
 37
37 -
 38
38 -
 39
39 -
 40
40 -
 41
41 -
 42
42 -
 43
43 -
 44
44 -
 45
45 -
 46
46 -
 47
47 -
 48
48 -
 49
49 -
 50
50 -
 51
51 -
 52
52 -
 53
53 -
54
-
55
-
56
-
57
-
58
-
59
-
60
-
61
-
62
-
63
-
64
-
65
-
66
-
67
-
68
-
69
-
70
-
71
-
72
-
73
-
74
-
75
-
76
-
77
-
78
-
79
-
80
-
81
-
82
-
83
-
84
-
85
-
86
-
87
-
88
-
89
-
90
-
91
-
92
-
93
-
94
-
95
-
96
-
97
-
98
-
99
-
100
-
101
-
102
-
103
-
104
-
105
-
106
-
107
-
108
-
109
-
110
-
111
-
112
-
113
-
114
-
115
-
116
-
117
-
118
-
119
-
120
-
121
-
122
-
123
-
124
-
125
-
126
-
127
-
128
-
129
-
130
-
131
-
132
-
133
-
134
-
135
-
136
-
137
-
138
-
139
-
140
-
141
-
142
-
143
-
144
-
145
-
146
-
147
-
148
-
149
-
150
-
151
-
152
-
153
-
154
-
155
-
156
-
157
-
158
-
159
-
160
-
161
-
162
-
163
-
164
-
165
-
166
-
167
-
168
-
169
 |
 |

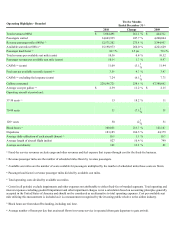
(7) Total operating and interest expenses excluding goodwill impairment and other impairment charges as well as the gain on bargain purchase
divided by available seat miles. Total operating and interest expenses excluding goodwill impairment and other impairment charges as well as
the gain on bargain purchase is not a calculation based on accounting principles generally accepted in the United States of America and
should not be considered as an alternative to total operating expenses. Cost per available seat mile utilizing this measurement is included as
it is a measurement recognized by the investing public relative to the airline industry.
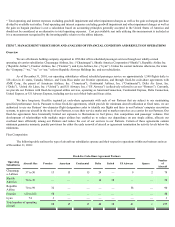
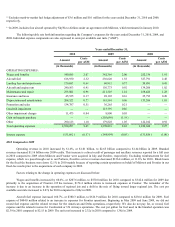
ITEM 7. MANAGEMENT’S DISCUSSION AND ANALYSIS OF FINANCIAL CONDITION AND RESULTS OF OPERATIONS
Overview
We are a Delaware holding company organized in 1996 that offers scheduled passenger services through our wholly-owned
operating air carrier subsidiaries: Chautauqua Airlines, Inc. (“Chautauqua”), Shuttle America Corporation (“Shuttle”), Republic Airline Inc.
(“Republic Airline”), Frontier Airlines, Inc. (“Frontier”), and Lynx Airlines, Inc. (“Lynx”). Unless the context indicates otherwise, the terms
the “Company,” “we,” “us,” or “our,” refer to Republic Airways Holdings Inc. and our subsidiaries.
As of December 31, 2010, our operating subsidiaries offered scheduled passenger service on approximately 1,540 flights daily to
128 cities in 41 states, Canada, Mexico, and Costa Rica under our Frontier operations, and through fixed-fee code-share agreements with
AMR Corp., the parent of American Airlines, Inc. (“American”), Continental Airlines, Inc. (“Continental”), Delta Air Lines, Inc.
(“Delta”), United Air Lines, Inc. (“United”), and US Airways, Inc. (“US Airways”) (collectively referred to as our “Partners”). Currently,
we provide our Partners with fixed-fee regional airline services, operating as AmericanConnection, Continental Express, Delta Connection,
United Express, or US Airways Express, including service out of their hubs and focus cities.
We have long-term, fixed-fee regional jet code-share agreements with each of our Partners that are subject to our maintaining
specified performance levels. Pursuant to these fixed-fee agreements, which provide for minimum aircraft utilization at fixed rates, we are
authorized to use our Partners' two-character flight designation codes to identify our flights and fares in our Partners' computer reservation
systems, to paint our aircraft in the style of our Partners, to use their service marks and to market ourselves as a carrier for our Partners. Our
fixed-fee agreements have historically limited our exposure to fluctuations in fuel prices, fare competition and passenger volumes. Our
development of relationships with multiple major airlines has enabled us to reduce our dependence on any single airline, allocate our
overhead more efficiently among our Partners and reduce the cost of our services to our Partners. Certain of these agreements contain
minimum guarantee amounts, penalty provisions for either the early removal of aircraft or agreement termination for activity levels below the
minimums.
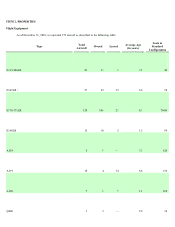
Fleet Composition
The following table outlines the type of aircraft our subsidiaries operate and their respective operations within our business units as
of December 31, 2010:
Fixed-Fee Code-Share Agreement Partners
Operating
Subsidiaries Aircraft Size Frontier American Continental Delta United US Airways Spares
Number
of
Aircraft
Chautauqu
a Airlines 37 to 50 13 15 15 24
—
9 2 78
Shuttle
America 70 to 76
—
—
—
16 38
—
—
54
Republic
Airline 70 to 99 32
—
—
—
—
58
—
90
Frontier 120 to 162 50
—
—
—
—
—
—
50
Lynx 74 3
—
—
—
—
—
—
3
Total number of operating
aircraft 98 15 15 40 38 67 2 275