Frontier Airlines 2010 Annual Report Download - page 115
Download and view the complete annual report
Please find page 115 of the 2010 Frontier Airlines annual report below. You can navigate through the pages in the report by either clicking on the pages listed below, or by using the keyword search tool below to find specific information within the annual report.-
 1
1 -
2
-
3
-
4
-
5
-
6
-
7
-
8
-
9
-
10
-
11
-
12
-
13
-
14
-
15
-
16
-
17
-
18
-
19
-
20
-
21
-
22
-
23
-
24
-
25
-
26
-
27
-
28
-
29
-
30
-
31
-
32
-
33
-
34
-
35
-
36
-
37
-
38
-
39
-
40
-
41
-
42
-
43
-
44
-
45
-
46
-
47
-
48
-
49
-
50
-
51
-
52
-
53
-
54
-
55
-
56
-
57
-
58
-
59
-
60
-
61
-
62
-
63
-
64
-
65
-
66
-
67
-
68
-
69
-
70
-
71
-
72
-
73
-
74
-
75
-
76
-
77
-
78
-
79
-
80
-
81
-
82
-
83
-
84
-
85
-
86
-
87
-
88
-
89
-
90
-
91
-
92
-
93
-
94
-
95
-
96
-
97
-
98
-
99
-
100
-
101
-
102
-
103
-
104
-
 105
105 -
 106
106 -
 107
107 -
 108
108 -
 109
109 -
 110
110 -
 111
111 -
 112
112 -
 113
113 -
 114
114 -
 115
115 -
 116
116 -
 117
117 -
 118
118 -
 119
119 -
 120
120 -
 121
121 -
 122
122 -
 123
123 -
 124
124 -
 125
125 -
126
-
127
-
128
-
129
-
130
-
131
-
132
-
133
-
134
-
135
-
136
-
137
-
138
-
139
-
140
-
141
-
142
-
143
-
144
-
145
-
146
-
147
-
148
-
149
-
150
-
151
-
152
-
153
-
154
-
155
-
156
-
157
-
158
-
159
-
160
-
161
-
162
-
163
-
164
-
165
-
166
-
167
-
168
-
169
 |
 |

Employee Stock Options
The 2002 and 2007 Equity Incentive Plan provides for the granting of up to 5,000,000 shares of our common stock of which 55,215
and 304,792 shares, respectively, remain available for issuance under the plan as of December 31, 2010. Stock options granted typically vest
ratably over the term of the employment agreements or between 36 and 48 months and are granted with exercise prices equal to market prices
on the date of grant. The options normally expire ten years from the date of grant. Options are typically granted to officers and key
employees selected by the Compensation Committee of the Board of Directors and have exercise prices ranging from $4.10 to $20.27.
Non-employee Director Stock Options
The Company also granted options for non-employee directors on the day prior to commencement of the Company’ s initial public
offering at a price equal to the fair market value of the common stock on the date of the grant. These options vested over a 3 year period with
1/24 of the shares vesting monthly for the first 12 months and 1/48 of the shares vesting monthly over the remaining 24 months. Additionally,
non-employee directors receive 2,500 options on the first trading day after each annual meeting of stockholders at which he or she is
re-elected as a non-employee director. These options vest ratably over 12 months of continuous service. The non-employee options are
exercisable until 10 years from the date of grant.
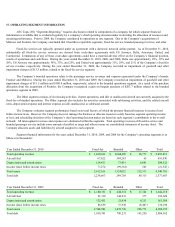
The following table summarizes option activity under the stock option plans as of December 31, 2010:
Options
Weighted
Average
Exercise Price
Aggregate
Intrinsic Value
Weighted Average
Contractual Term
(in years)
Outstanding at January 1, 2010 4,306,002 $ 14.42
Granted 1,242,000 6.64
Exercised (32,083 ) 4.14
Forfeited (226,000 ) 13.51
Outstanding at December 31, 2010 5,289,919 $ 12.69 $ 2,599,100 7.31
Vested or expected to vest at December 31, 2010 5,101,551 $ 12.87 $ 2,328,103 7.25
Exercisable at December 31, 2010 3,235,752 $ 15.67 $ 299,408 6.30
The intrinsic value of options exercised during the years ended December 31, 2010, 2009 and 2008 was not material.
There were 2,744,940 and 1,707,752 options exercisable at December 31, 2009 and 2008 respectively. The weighted average
exercise price for the options exercisable at December 31, 2009 and 2008 was $16.03 and $16.24, respectively. The remaining contractual life
for the options outstanding at December 31, 2009 and 2008 was 7.08 years and 7.34 years, respectively.
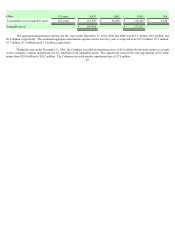
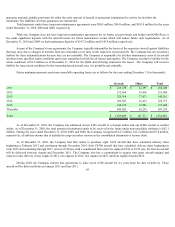
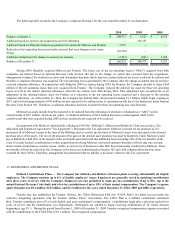
During the years ended December 31, 2010, 2009 and 2008, $2.9 million ($1.7 million net of tax), $4.2 million ($2.6 million net of
tax) and $3.6 million ($2.2 million net of tax), respectively, was charged to expense relating to the stock option plans. The Company has a
policy of issuing new common shares to satisfy the exercise of stock options. At December 31, 2010 there was $7.9 million of unrecognized
stock-based employee compensation expense for unvested stock options, and the expected remaining expense period is 3.5 years. The
Company did not recognize excess tax benefits related to stock option exercises in 2010, 2009 or 2008 since the Company did not have
taxable income during these years.
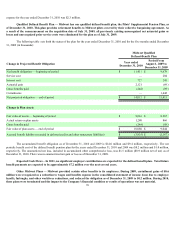
The weighted average grant date fair value of options granted in 2010, 2009 and 2008 was $3.15, $2.32, and $5.36, respectively. The
Company estimates the fair value of stock options issued using the Black-Scholes option pricing model. Expected volatilities are based on the
historical volatility of the Company’ s stock and other factors. The Company uses historical data to estimate option exercises and employee
terminations within the valuation model. Dividends were based on an estimated dividend yield. The risk-free rates for the periods within the
contractual life of the option are based on the U.S. Treasury rates in effect at the time of the grant. The forfeiture rate is based on historical
information and management’ s best estimate of future forfeitures. The expected term of options granted is derived from historical exercise
experience and represents the period of time the Company expects options granted to be outstanding. Option valuation models require the
input of subjective assumptions including the expected volatility and lives. Actual values of grants could vary significantly from the results of