Frontier Airlines 2010 Annual Report Download - page 59
Download and view the complete annual report
Please find page 59 of the 2010 Frontier Airlines annual report below. You can navigate through the pages in the report by either clicking on the pages listed below, or by using the keyword search tool below to find specific information within the annual report.-
 1
1 -
2
-
3
-
4
-
5
-
6
-
7
-
8
-
9
-
10
-
11
-
12
-
13
-
14
-
15
-
16
-
17
-
18
-
19
-
20
-
21
-
22
-
23
-
24
-
25
-
26
-
27
-
28
-
29
-
30
-
31
-
32
-
33
-
34
-
35
-
36
-
37
-
38
-
39
-
40
-
41
-
42
-
43
-
44
-
45
-
46
-
47
-
48
-
 49
49 -
 50
50 -
 51
51 -
 52
52 -
 53
53 -
 54
54 -
 55
55 -
 56
56 -
 57
57 -
 58
58 -
 59
59 -
 60
60 -
 61
61 -
 62
62 -
 63
63 -
 64
64 -
 65
65 -
 66
66 -
 67
67 -
 68
68 -
 69
69 -
70
-
71
-
72
-
73
-
74
-
75
-
76
-
77
-
78
-
79
-
80
-
81
-
82
-
83
-
84
-
85
-
86
-
87
-
88
-
89
-
90
-
91
-
92
-
93
-
94
-
95
-
96
-
97
-
98
-
99
-
100
-
101
-
102
-
103
-
104
-
105
-
106
-
107
-
108
-
109
-
110
-
111
-
112
-
113
-
114
-
115
-
116
-
117
-
118
-
119
-
120
-
121
-
122
-
123
-
124
-
125
-
126
-
127
-
128
-
129
-
130
-
131
-
132
-
133
-
134
-
135
-
136
-
137
-
138
-
139
-
140
-
141
-
142
-
143
-
144
-
145
-
146
-
147
-
148
-
149
-
150
-
151
-
152
-
153
-
154
-
155
-
156
-
157
-
158
-
159
-
160
-
161
-
162
-
163
-
164
-
165
-
166
-
167
-
168
-
169
 |
 |
Working capital deficits are customary for airlines since the air traffic liability and a portion of the deferred frequent flyer revenue
are classified as current liabilities. Our liquidity depends on the number of passengers who fly in our Frontier operations, the fares they pay,
the cost of fuel, our operating and capital expenditures, our financing activities, the financial strength of our Partners in relation to our
fixed-fee business, and the amount of cash holdbacks imposed by our credit card processors. We cannot predict what the effect on our
business might be from the extremely competitive environment we are operating in or from events that are beyond our control, such as
volatile fuel prices, an economic recession, a global credit and liquidity crisis, weather-related disruptions, the impact of airline bankruptcies
or consolidations, U.S. military actions or acts of terrorism.
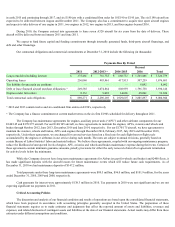
Net cash provided by operating activities was $256.4 million in 2010 compared to $168.6 million in 2009. The $87.8 million
increase in operating cash flows is primarily attributable to the 5% reduction on our credit card holdbacks and the timing of the processing of
the holdback settlements. The remainder of the increase was attributable to timing differences in our working capital.
Net cash provided by investing activities was $2.5 million in 2010 compared to $3.4 million in 2009. During 2010, the Company
did not purchase any aircraft but spent $27.1 million on engines and $31.6 million on other maintenance and equipment, which was offset by
sold aircraft and other equipment of $77.4 million.
Net cash used in financing activities was $125.3 million in 2010 compared to $144.1 million in 2009. During 2010, the Company
received net proceeds of $101.9 million from a second public offering completed in November. The Company made principal repayments of
$214.4 million and retired $60.0 million of aircraft debt totaling $274.4 million compared to repayments of $145.7 million and retirements of
$70.9 million totaling $216.6 million in 2009. The company received proceeds of $49.3 million from the financing of other equipment during
2010.
2009 compared to 2008
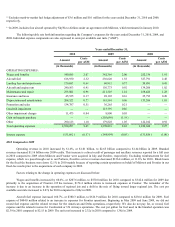
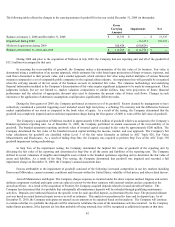
As of December 31, 2009, we had total cash of $350.2 million of which $157.5 million was unrestricted. At December 31, 2009, we
had a working capital deficit of $155.2 million.
Working capital deficits are customary for airlines since the air traffic liability and a portion of the deferred frequent flyer revenue
are classified as current liabilities. Our liquidity depends to a large extent on the financial strength of our Partners in relation to our fixed-fee
business and the number of passengers who fly in our branded passenger service, the fares they pay, our operating and capital expenditures,
our financing activities, the amount of cash holdbacks imposed by our credit card processors, and the cost of fuel. We cannot predict what
the effect on our business might be from the extremely competitive environment we are operating in or from events that are beyond our
control, such as volatile fuel prices, the economic recession, the global credit and liquidity crisis, weather-related disruptions, the impact of
airline bankruptcies or consolidations, U.S. military actions or acts of terrorism.
Net cash provided by operating activities was $168.6 million in 2009 compared to $242.3 million in 2008. The $73.7 million
decrease in operating cash flows is primarily attributable to the lower operating margin associated with our branded operations and the related
reductions in our net income period over period of $44.9 million.
Net cash provided by (used in) investing activities was $3.4 million in 2009 compared to ($81.9) million in 2008. During 2009, the
Company acquired and debt financed 3 E175 aircraft and 10 E190 aircraft. The total debt related to these aircraft of $280.0 million was
obtained from banks at terms of 10 to 15 years and fixed interest rates ranging from 2.80% to 2.94% and variable rates at LIBOR plus a
margin. Cash used in the acquisition of aircraft and other equipment, net of aircraft deposits totaled $25.5 million in 2009 and $59.2 million
in 2008. The Company has lease financed all other aircraft deliveries during 2009. The Company received proceeds from the sale of its
E135 assets and other equipment totaling $72.9 million in 2009 compared to $52.9 million in 2008. Additionally, the Company funded notes
receivable of approximately $61.1 million (to Frontier, US Airways, Midwest, and Mokulele) in 2009 compared to $55 million in
2008. Additionally, the Company acquired new businesses Midwest and Frontier, net of cash acquired totaling $23.3 million.
Net cash used in financing activities was $144.1 million in 2009 compared to $194.7 million in 2008. During 2009, the Company
received proceeds of $75.1 million from the refinancing of aircraft and issuance of debt compared to $6.7 million in 2008. During 2009, the
Company made principal repayments of $145.7 million and retired $70.9 million of aircraft debt totaling $216.6 million compared to
repayments of $113.6 million and retirements of $50.0 million totaling $163.6 million in 2008. During the prior year, the Company
repurchased $39.4 million of treasury stock and there were no treasury stock repurchases in 2009.
37