Frontier Airlines 2010 Annual Report Download - page 117
Download and view the complete annual report
Please find page 117 of the 2010 Frontier Airlines annual report below. You can navigate through the pages in the report by either clicking on the pages listed below, or by using the keyword search tool below to find specific information within the annual report.-
 1
1 -
2
-
3
-
4
-
5
-
6
-
7
-
8
-
9
-
10
-
11
-
12
-
13
-
14
-
15
-
16
-
17
-
18
-
19
-
20
-
21
-
22
-
23
-
24
-
25
-
26
-
27
-
28
-
29
-
30
-
31
-
32
-
33
-
34
-
35
-
36
-
37
-
38
-
39
-
40
-
41
-
42
-
43
-
44
-
45
-
46
-
47
-
48
-
49
-
50
-
51
-
52
-
53
-
54
-
55
-
56
-
57
-
58
-
59
-
60
-
61
-
62
-
63
-
64
-
65
-
66
-
67
-
68
-
69
-
70
-
71
-
72
-
73
-
74
-
75
-
76
-
77
-
78
-
79
-
80
-
81
-
82
-
83
-
84
-
85
-
86
-
87
-
88
-
89
-
90
-
91
-
92
-
93
-
94
-
95
-
96
-
97
-
98
-
99
-
100
-
101
-
102
-
103
-
104
-
105
-
106
-
 107
107 -
 108
108 -
 109
109 -
 110
110 -
 111
111 -
 112
112 -
 113
113 -
 114
114 -
 115
115 -
 116
116 -
 117
117 -
 118
118 -
 119
119 -
 120
120 -
 121
121 -
 122
122 -
 123
123 -
 124
124 -
 125
125 -
 126
126 -
 127
127 -
128
-
129
-
130
-
131
-
132
-
133
-
134
-
135
-
136
-
137
-
138
-
139
-
140
-
141
-
142
-
143
-
144
-
145
-
146
-
147
-
148
-
149
-
150
-
151
-
152
-
153
-
154
-
155
-
156
-
157
-
158
-
159
-
160
-
161
-
162
-
163
-
164
-
165
-
166
-
167
-
168
-
169
 |
 |

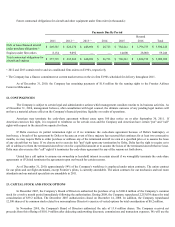
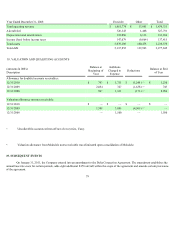
The following assumptions were used to value stock option grants during the following periods:
December 31,
2010 2009 2008
Dividend yield
—
—
—
Expected volatility 60%-61% 58%-63% 39%-53%
Risk-free interest rate 1.2%-2.0% 2.2%-2.9% 1.7%-3.2%
Expected life (in years) 4-5 4-5 4-5
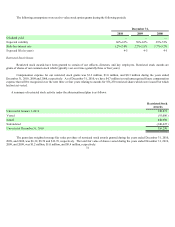
Restricted Stock Grants
Restricted stock awards have been granted to certain of our officers, directors, and key employees. Restricted stock awards are
grants of shares of our common stock which typically vest over time (generally three or four years).
Compensation expense for our restricted stock grants was $1.2 million, $1.0 million, and $0.3 million during the years ended
December 31, 2010, 2009 and 2008, respectively. As of December 31, 2010, we have $4.7 million in total unrecognized future compensation
expense that will be recognized over the next three or four years relating to awards for 556,250 restricted shares which were issued but which
had not yet vested.
A summary of restricted stock activity under the aforementioned plan is as follows:
Restricted Stock
Awards
Unvested at January 1, 2010 349,875
Vested (93,000 )
Issued 440,000
Surrendered (140,625 )
Unvested at December 31, 2010 556,250
The grant date weighted-average fair value per share of restricted stock awards granted during the years ended December 31, 2010,
2009, and 2008, was $6.32, $8.59 and $12.70, respectively. The total fair value of shares vested during the years ended December 31, 2010,
2009, and 2008, was $1.2 million, $1.0 million, and $0.4 million, respectively.
72