Frontier Airlines 2010 Annual Report Download - page 37
Download and view the complete annual report
Please find page 37 of the 2010 Frontier Airlines annual report below. You can navigate through the pages in the report by either clicking on the pages listed below, or by using the keyword search tool below to find specific information within the annual report.-
 1
1 -
2
-
3
-
4
-
5
-
6
-
7
-
8
-
9
-
10
-
11
-
12
-
13
-
14
-
15
-
16
-
17
-
18
-
19
-
20
-
21
-
22
-
23
-
24
-
25
-
26
-
 27
27 -
 28
28 -
 29
29 -
 30
30 -
 31
31 -
 32
32 -
 33
33 -
 34
34 -
 35
35 -
 36
36 -
 37
37 -
 38
38 -
 39
39 -
 40
40 -
 41
41 -
 42
42 -
 43
43 -
 44
44 -
 45
45 -
 46
46 -
 47
47 -
48
-
49
-
50
-
51
-
52
-
53
-
54
-
55
-
56
-
57
-
58
-
59
-
60
-
61
-
62
-
63
-
64
-
65
-
66
-
67
-
68
-
69
-
70
-
71
-
72
-
73
-
74
-
75
-
76
-
77
-
78
-
79
-
80
-
81
-
82
-
83
-
84
-
85
-
86
-
87
-
88
-
89
-
90
-
91
-
92
-
93
-
94
-
95
-
96
-
97
-
98
-
99
-
100
-
101
-
102
-
103
-
104
-
105
-
106
-
107
-
108
-
109
-
110
-
111
-
112
-
113
-
114
-
115
-
116
-
117
-
118
-
119
-
120
-
121
-
122
-
123
-
124
-
125
-
126
-
127
-
128
-
129
-
130
-
131
-
132
-
133
-
134
-
135
-
136
-
137
-
138
-
139
-
140
-
141
-
142
-
143
-
144
-
145
-
146
-
147
-
148
-
149
-
150
-
151
-
152
-
153
-
154
-
155
-
156
-
157
-
158
-
159
-
160
-
161
-
162
-
163
-
164
-
165
-
166
-
167
-
168
-
169
 |
 |

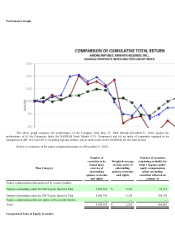
Performance Graph
The above graph compares the performance of the Company from May 27, 2004 through December 31, 2010, against the
performance of (i) the Composite Index for NASDAQ Stock Market (U.S. Companies) and (ii) an index of companies engaged in air
transportation (SIC 4512 and 4513), including regional airlines, whose stocks trade on the NASDAQ, for the same period.
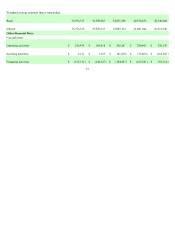
Below is a summary of the equity compensation plans as of December 31, 2010:
Plan Category
Number of
securities to be
issued upon
exercise of
outstanding
options, warrants
and rights
Weighted-avera
g
e
exercise price of
outstanding
options, warrants
and rights
Number of securities
remaining available for
future issuance under
equity compensation
plans (excluding
securities reflected in
column A)
Equity compensation plans approved by security holders
Options outstanding under the 2002 Equity Incentive Plan 1,285,169 $ 15.26 55,215
Options outstanding under the 2007 Equity Incentive Plan 4,004,750 11.88 304,792
Equity compensation plans not approved by security holders
—
—
—
Total 5,289,919 $ 12.69 360,007
Unregistered Sales of Equity Securities