Frontier Airlines 2010 Annual Report Download - page 41
Download and view the complete annual report
Please find page 41 of the 2010 Frontier Airlines annual report below. You can navigate through the pages in the report by either clicking on the pages listed below, or by using the keyword search tool below to find specific information within the annual report.-
 1
1 -
2
-
3
-
4
-
5
-
6
-
7
-
8
-
9
-
10
-
11
-
12
-
13
-
14
-
15
-
16
-
17
-
18
-
19
-
20
-
21
-
22
-
23
-
24
-
25
-
26
-
27
-
28
-
29
-
30
-
 31
31 -
 32
32 -
 33
33 -
 34
34 -
 35
35 -
 36
36 -
 37
37 -
 38
38 -
 39
39 -
 40
40 -
 41
41 -
 42
42 -
 43
43 -
 44
44 -
 45
45 -
 46
46 -
 47
47 -
 48
48 -
 49
49 -
 50
50 -
 51
51 -
52
-
53
-
54
-
55
-
56
-
57
-
58
-
59
-
60
-
61
-
62
-
63
-
64
-
65
-
66
-
67
-
68
-
69
-
70
-
71
-
72
-
73
-
74
-
75
-
76
-
77
-
78
-
79
-
80
-
81
-
82
-
83
-
84
-
85
-
86
-
87
-
88
-
89
-
90
-
91
-
92
-
93
-
94
-
95
-
96
-
97
-
98
-
99
-
100
-
101
-
102
-
103
-
104
-
105
-
106
-
107
-
108
-
109
-
110
-
111
-
112
-
113
-
114
-
115
-
116
-
117
-
118
-
119
-
120
-
121
-
122
-
123
-
124
-
125
-
126
-
127
-
128
-
129
-
130
-
131
-
132
-
133
-
134
-
135
-
136
-
137
-
138
-
139
-
140
-
141
-
142
-
143
-
144
-
145
-
146
-
147
-
148
-
149
-
150
-
151
-
152
-
153
-
154
-
155
-
156
-
157
-
158
-
159
-
160
-
161
-
162
-
163
-
164
-
165
-
166
-
167
-
168
-
169
 |
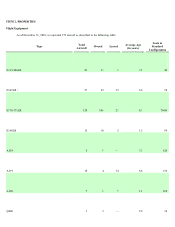
 |

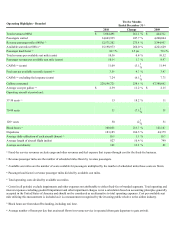
Years Ended December 31,
2010 (1) 2009 (1) 2008 2007 2006
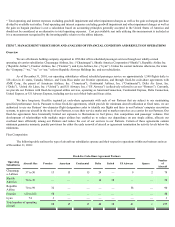
Airline Operating Data:
Passengers carried (000’ s) 31,959 22,984 18,918 16,287 12,666
Revenue passenger miles (000’ s) (3) 21,143,825 12,905,590 9,700,978 8,581,836 6,650,399
Available seat miles (000’ s) (4) 26,547,253 17,116,528 13,213,701 11,511,795 9,154,719
Passenger load factor (5) 79.6 % 75.4 % 73.4 % 74.5 % 72.6 %
Revenue per available seat mile (6) $ 0.100 $ 0.096 $ 0.112 $ 0.112 $ 0.125
Cost per available seat mile (7) $ 0.100 $ 0.093 $ 0.103 $ 0.102 $ 0.112
Average passenger trip length (miles) 662 562 513 527 525
Number of aircraft in operations (end
of period):
Regional Jets:
Owned 150 150 142 131 109
Leased 72 78 79 88 62
Airbus:
Owned 11 13
—
—
—
Leased 39 38
—
—
—
Q400:
Owned 3 6
—
—
—
Leased
—
5
—
—
—
Total aircraft 275 290 221 219 171
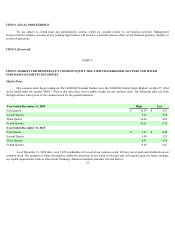
As of December 31,
2010 2009 2008 2007 2006
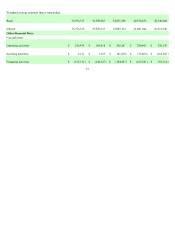
Consolidated Balance Sheet Data: (in thousands)
Cash and cash equivalents $ 291,150 $ 157,532 $ 129,656 $ 164,004 $ 195,528
Aircraft and other equipment—net 3,173,486 3,418,160 2,692,410 2,308,726 1,889,717
Total assets 4,348,701 4,450,472 3,236,578 2,773,078 2,358,441
Long-term debt, including current maturities 2,577,683 2,789,419 2,277,845 1,913,580 1,568,803
Total stockholders' equity 609,683 517,880 475,939 426,086 508,829
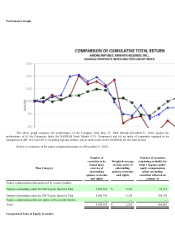
(1) The full year 2010 and 2009 are not comparable to the years ended December 31, 2008, 2007, and 2006. The results of operations for 2009
include Midwest beginning in August 2009 and Frontier in October 2009 and include 12 months of the results of operations for Midwest and
Frontier during 2010. We also reclassified $31.4 million of on-board sales of LiveTV, liquor and food and baggage fees recorded in other
revenues to passenger revenues in our December 31, 2009 consolidated statement of income (loss). These reclassifications had no effect on
previously reported operating income or net income.
(2) As of December 31, 2010, all of our Partners provide substantially all of our aircraft fuel for our fixed fee business and the increase in fuel
expense was primarily attributable to a full year of expense related to flying completed in our Frontier operations. Beginning in May 2009