Frontier Airlines 2010 Annual Report Download - page 51
Download and view the complete annual report
Please find page 51 of the 2010 Frontier Airlines annual report below. You can navigate through the pages in the report by either clicking on the pages listed below, or by using the keyword search tool below to find specific information within the annual report.-
 1
1 -
2
-
3
-
4
-
5
-
6
-
7
-
8
-
9
-
10
-
11
-
12
-
13
-
14
-
15
-
16
-
17
-
18
-
19
-
20
-
21
-
22
-
23
-
24
-
25
-
26
-
27
-
28
-
29
-
30
-
31
-
32
-
33
-
34
-
35
-
36
-
37
-
38
-
39
-
40
-
 41
41 -
 42
42 -
 43
43 -
 44
44 -
 45
45 -
 46
46 -
 47
47 -
 48
48 -
 49
49 -
 50
50 -
 51
51 -
 52
52 -
 53
53 -
 54
54 -
 55
55 -
 56
56 -
 57
57 -
 58
58 -
 59
59 -
 60
60 -
 61
61 -
62
-
63
-
64
-
65
-
66
-
67
-
68
-
69
-
70
-
71
-
72
-
73
-
74
-
75
-
76
-
77
-
78
-
79
-
80
-
81
-
82
-
83
-
84
-
85
-
86
-
87
-
88
-
89
-
90
-
91
-
92
-
93
-
94
-
95
-
96
-
97
-
98
-
99
-
100
-
101
-
102
-
103
-
104
-
105
-
106
-
107
-
108
-
109
-
110
-
111
-
112
-
113
-
114
-
115
-
116
-
117
-
118
-
119
-
120
-
121
-
122
-
123
-
124
-
125
-
126
-
127
-
128
-
129
-
130
-
131
-
132
-
133
-
134
-
135
-
136
-
137
-
138
-
139
-
140
-
141
-
142
-
143
-
144
-
145
-
146
-
147
-
148
-
149
-
150
-
151
-
152
-
153
-
154
-
155
-
156
-
157
-
158
-
159
-
160
-
161
-
162
-
163
-
164
-
165
-
166
-
167
-
168
-
169
 |
 |
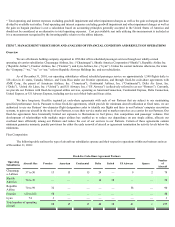
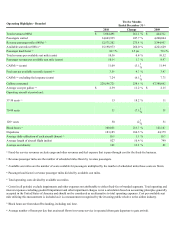
Operating Highlights - Branded Twelve Months
Ended December 31 (9)
2010 Change 2009
Total revenues (000's) $1,604,490 261.1 % $ 444,312
Passengers carried 14,603,935 247.7 % 4,200,044
Revenue passenger miles (000's) (2) 12,571,202 275.8 % 3,344,953
Available seat miles (000's) (3) 15,198,973 260.0 % 4,221,629
Passenger load factor (4) 82.7 % 3.5 pts 79.2 %
Total revenue per available seat mile (cents) 10.56 0.4 % 10.52
Passenger revenue per available seat mile (cents) 10.14 1.7 % 9.97
CASM,(5)(6) (cents) 11.09 (3.1 )
% 11.44
Fuel cost per available seat mile (cents) (10) 3.59 4.7 % 3.43
CASM,(5)(6) excluding fuel expense (cents) 7.24 (6.1 )
% 7.71
Gallons consumed 228,196,721 238.6 % 67,388,662
Average cost per gallon (10) $2.39 11.2 % $ 2.15
Operating aircraft at period end:
37-50 seats (11) 13 18.2 % 11
70-99 seats 35 (7.9 )
% 38
120+ seats 50 (2 )
% 51
Block hours (7) 380,050 213.7 % 121,167
Departures 183,185 184.5 % 64,379
Average daily utilization of each aircraft (hours) (8) 10.9 1.9 % 10.7
Average length of aircraft flight (miles) 827 10.4 % 749
Average seat density 100 13.6 % 88
(1) Fixed-fee service revenues exclude cargo and other revenues and fuel expense that is pass-through cost for the fixed-fee business.
(2) Revenue passenger miles are the number of scheduled miles flown by revenue passengers.
(3) Available seat miles are the number of seats available for passengers multiplied by the number of scheduled miles those seats are flown.
(4) Passenger load factor is revenue passenger miles divided by available seat miles.
(5) Total operating costs divided by available seat miles.
(6) Costs (in all periods) exclude impairments and other expenses not attributable to either fixed-fee or branded segments. Total operating and
interest expenses excluding goodwill impairment and other impairment charges is not a calculation based on accounting principles generally
accepted in the United States of America and should not be considered as an alternative to total operating expenses. Cost per available seat
mile utilizing this measurement is included as it is a measurement recognized by the investing public relative to the airline industry.
(7) Block hours are from takeoff to landing, including taxi time.
(8) Average number of hours per day that an aircraft flown in revenue service is operated (from gate departure to gate arrival).