Express Scripts 2013 Annual Report Download - page 98
Download and view the complete annual report
Please find page 98 of the 2013 Express Scripts annual report below. You can navigate through the pages in the report by either clicking on the pages listed below, or by using the keyword search tool below to find specific information within the annual report.-
 1
1 -
2
-
3
-
4
-
5
-
6
-
7
-
8
-
9
-
10
-
11
-
12
-
13
-
14
-
15
-
16
-
17
-
18
-
19
-
20
-
21
-
22
-
23
-
24
-
25
-
26
-
27
-
28
-
29
-
30
-
31
-
32
-
33
-
34
-
35
-
36
-
37
-
38
-
39
-
40
-
41
-
42
-
43
-
44
-
45
-
46
-
47
-
48
-
49
-
50
-
51
-
52
-
53
-
54
-
55
-
56
-
57
-
58
-
59
-
60
-
61
-
62
-
63
-
64
-
65
-
66
-
67
-
68
-
69
-
70
-
71
-
72
-
73
-
74
-
75
-
76
-
77
-
78
-
79
-
80
-
81
-
82
-
83
-
84
-
85
-
86
-
87
-
 88
88 -
 89
89 -
 90
90 -
 91
91 -
 92
92 -
 93
93 -
 94
94 -
 95
95 -
 96
96 -
 97
97 -
 98
98 -
 99
99 -
 100
100 -
 101
101 -
 102
102 -
 103
103 -
 104
104 -
 105
105 -
 106
106 -
 107
107 -
 108
108 -
109
-
110
-
111
-
112
-
113
-
114
-
115
-
116
-
117
-
118
-
119
-
120
-
121
-
122
-
123
-
124
 |
 |

Express Scripts 2013 Annual Report 98
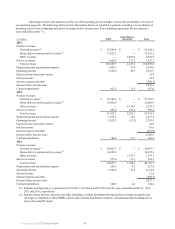
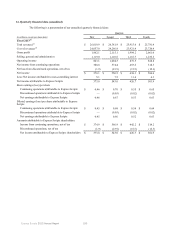
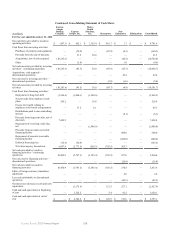
Operating income is the measure used by our chief operating decision maker to assess the performance of each of
our operating segments. The following table presents information about our reportable segments, including a reconciliation of
operating income from continuing operations to income before income taxes from continuing operations for the respective
years ended December 31.
(in millions) PBM
Other Business
Operations Total
2013
Product revenues:
Network revenues(1) $ 63,244.4 $ — $ 63,244.4
Home delivery and specialty revenues(2) 37,621.2 — 37,621.2
Other revenues — 2,001.9 2,001.9
Service revenues 1,020.1 211.2 1,231.3
Total revenues 101,885.7 2,213.1 104,098.8
Depreciation and amortization expense 2,419.1 27.9 2,447.0
Operating income 3,502.0 49.7 3,551.7
Equity income from joint venture 32.8
Interest income 41.9
Interest expense and other (596.1)
Income before income taxes 3,030.3
Capital expenditures 411.2 11.8 423.0
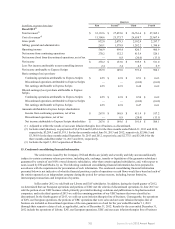
2012
Product revenues:
Network revenues(1) $ 57,765.5 $ — $ 57,765.5
Home delivery and specialty revenues(2) 32,860.9 — 32,860.9
Other revenues — 2,118.7 2,118.7
Service revenues 805.8 163.4 969.2
Total revenues 91,432.2 2,282.1 93,714.3
Depreciation and amortization expense 1,833.3 38.1 1,871.4
Operating income 2,815.1 (21.2) 2,793.9
Equity income from joint venture 14.9
Interest income 10.6
Interest expense and other (619.0)
Income before income taxes 2,200.4
Capital expenditures 148.5 11.7 160.2
2011
Product revenues:
Network revenues(1) $ 30,007.3 $ — $ 30,007.3
Home delivery and specialty revenues(2) 14,547.4 — 14,547.4
Other revenues — 1,279.3 1,279.3
Service revenues 273.0 21.3 294.3
Total revenues 44,827.7 1,300.6 46,128.3
Depreciation and amortization expense 245.2 8.2 253.4
Operating income 2,302.6 11.8 2,314.4
Interest income 12.4
Interest expense and other (299.7)
Income before income taxes 2,027.1
Capital expenditures 140.0 4.4 144.4
(1) Includes retail pharmacy co-payments of $12,620.3, $11,668.6 and $5,786.6 for the years ended December 31, 2013,
2012 and 2011, respectively.
(2) Includes home delivery, specialty and other including: (a) drugs distributed through patient assistance programs and
(b) drugs we distribute to other PBMs’ clients under limited distribution contracts with pharmaceutical manufacturers,
and (c) FreedomFP claims.