Express Scripts 2013 Annual Report Download - page 40
Download and view the complete annual report
Please find page 40 of the 2013 Express Scripts annual report below. You can navigate through the pages in the report by either clicking on the pages listed below, or by using the keyword search tool below to find specific information within the annual report.-
 1
1 -
2
-
3
-
4
-
5
-
6
-
7
-
8
-
9
-
10
-
11
-
12
-
13
-
14
-
15
-
16
-
17
-
18
-
19
-
20
-
21
-
22
-
23
-
24
-
25
-
26
-
27
-
28
-
29
-
 30
30 -
 31
31 -
 32
32 -
 33
33 -
 34
34 -
 35
35 -
 36
36 -
 37
37 -
 38
38 -
 39
39 -
 40
40 -
 41
41 -
 42
42 -
 43
43 -
 44
44 -
 45
45 -
 46
46 -
 47
47 -
 48
48 -
 49
49 -
 50
50 -
51
-
52
-
53
-
54
-
55
-
56
-
57
-
58
-
59
-
60
-
61
-
62
-
63
-
64
-
65
-
66
-
67
-
68
-
69
-
70
-
71
-
72
-
73
-
74
-
75
-
76
-
77
-
78
-
79
-
80
-
81
-
82
-
83
-
84
-
85
-
86
-
87
-
88
-
89
-
90
-
91
-
92
-
93
-
94
-
95
-
96
-
97
-
98
-
99
-
100
-
101
-
102
-
103
-
104
-
105
-
106
-
107
-
108
-
109
-
110
-
111
-
112
-
113
-
114
-
115
-
116
-
117
-
118
-
119
-
120
-
121
-
122
-
123
-
124
 |
 |

Express Scripts 2013 Annual Report 40
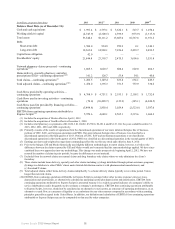
Item 7 — Management’s Discussion and Analysis of Financial Condition and Results of Operations
OVERVIEW
On April 2, 2012, Express Scripts, Inc. (“ESI”) consummated a merger (the “Merger”) with Medco Health
Solutions, Inc. (“Medco”) and both ESI and Medco became wholly-owned subsidiaries of Express Scripts Holding Company
(the “Company” or “Express Scripts”). “We,” “our” or “us” refers to Express Scripts Holding Company and its subsidiaries.
The consolidated financial statements (and other data, such as claims volume) reflect the results of operations and financial
position of ESI for all periods prior to April 1, 2012. However, references to amounts for periods after the closing of the Merger
on April 2, 2012 relate to Express Scripts.
As the largest full-service pharmacy benefit management (“PBM”) company in the United States, we provide
healthcare management and administration services on behalf of our clients, which include managed care organizations, health
insurers, third-party administrators, employers, union-sponsored benefit plans, workers’ compensation plans and government
health programs. We report segments on the basis of services offered and have determined we have two reportable segments:
PBM and Other Business Operations. During the second quarter of 2012, we reorganized our segments to better reflect our
structure following the Merger. Our other international retail network pharmacy administration business (which was
substantially shut down as of December 31, 2012) was reorganized from our PBM segment into our Other Business Operations
segment. During the third quarter of 2011, we reorganized our FreedomFP line of business from our Other Business Operations
segment into our PBM segment. Our integrated PBM services include retail network pharmacy administration, home delivery
pharmacy services, benefit design consultation, drug utilization review, drug formulary management, clinical solutions to
improve health outcomes, Medicare Part D, Medicaid and Public Exchange offerings, specialty pharmacy services, fertility
services to providers and patients, administration of a group purchasing organization and consumer health and drug
information.
Through our Other Business Operations segment, we provide services including distribution of pharmaceuticals
and medical supplies to providers and clinics and scientific evidence to guide the safe, effective and affordable use of
medicines.
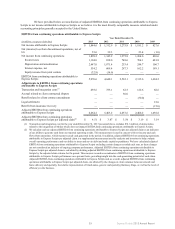
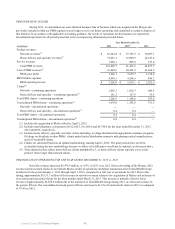
Revenue generated by our segments can be classified as either tangible product revenue or service revenue. We
earn tangible product revenue from the sale of prescription drugs by retail pharmacies in our retail pharmacy networks and
from dispensing prescription drugs from our home delivery and specialty pharmacies. Service revenue includes administrative
fees associated with the administration of retail pharmacy networks contracted by certain clients, medication counseling
services and certain specialty distribution services. Tangible product revenue generated by our PBM and Other Business
Operations segments represented 98.8% of revenues for the year ended December 31, 2013, as compared to 99.0% and 99.4%
for the years ended December 31, 2012 and 2011, respectively.
MERGER TRANSACTION
As a result of the Merger on April 2, 2012, Medco and ESI each became wholly-owned subsidiaries of Express
Scripts and former Medco and ESI stockholders became owners of Express Scripts stock, which is listed for trading on the
Nasdaq. Upon closing of the Merger, former ESI stockholders owned approximately 59% of Express Scripts and former Medco
stockholders owned approximately 41% of Express Scripts.