Express Scripts 2013 Annual Report Download - page 94
Download and view the complete annual report
Please find page 94 of the 2013 Express Scripts annual report below. You can navigate through the pages in the report by either clicking on the pages listed below, or by using the keyword search tool below to find specific information within the annual report.-
 1
1 -
2
-
3
-
4
-
5
-
6
-
7
-
8
-
9
-
10
-
11
-
12
-
13
-
14
-
15
-
16
-
17
-
18
-
19
-
20
-
21
-
22
-
23
-
24
-
25
-
26
-
27
-
28
-
29
-
30
-
31
-
32
-
33
-
34
-
35
-
36
-
37
-
38
-
39
-
40
-
41
-
42
-
43
-
44
-
45
-
46
-
47
-
48
-
49
-
50
-
51
-
52
-
53
-
54
-
55
-
56
-
57
-
58
-
59
-
60
-
61
-
62
-
63
-
64
-
65
-
66
-
67
-
68
-
69
-
70
-
71
-
72
-
73
-
74
-
75
-
76
-
77
-
78
-
79
-
80
-
81
-
82
-
83
-
 84
84 -
 85
85 -
 86
86 -
 87
87 -
 88
88 -
 89
89 -
 90
90 -
 91
91 -
 92
92 -
 93
93 -
 94
94 -
 95
95 -
 96
96 -
 97
97 -
 98
98 -
 99
99 -
 100
100 -
 101
101 -
 102
102 -
 103
103 -
 104
104 -
105
-
106
-
107
-
108
-
109
-
110
-
111
-
112
-
113
-
114
-
115
-
116
-
117
-
118
-
119
-
120
-
121
-
122
-
123
-
124
 |
 |

Express Scripts 2013 Annual Report 94
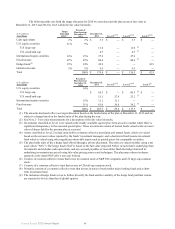
The following table sets forth the target allocation for 2014 by asset class and the plan assets at fair value at
December 31, 2013 and 2012 by level within the fair value hierarchy:
($ in millions)
Asset Class
Target
Allocation
2014(1)
Percent of
Plan Assets at
December 31,
2013
December 31,
2013 Level 1(2)(3) Level 2(2)(4) Level 3(2)(5)
Cash equivalents 2% 2% $ 3.3 $ — $ 3.3 $ —
U.S. equity securities 11% 9%
U.S. large-cap 11.0 — 11.0 (6) —
U.S. small/mid-cap 4.7 — 4.7 (7) —
International equity securities 12% 15% 27.9 — 27.9 —
Fixed income 47% 45% 80.6 — 80.6 (8) —
Hedge funds(9) 23% 24% 42.9 — — 42.9
Global real estate 5% 5% 9.0 — 9.0 —
Total 100% $ 179.4 $ — $ 136.5 $ 42.9
($ in millions)
Asset Class
Percent of
Plan Assets at
December 31,
2012
December 31,
2012 Level 1(2)(3) Level 2(2)(4) Level 3(2)
U.S. equity securities 54%
U.S. large-cap $ 60.3 $ — $ 60.3 (6) $—
U.S. small/mid-cap 51.1 27.9 23.2 (7) —
International equity securities 15% 31.1 31.1 — —
Fixed income 31% 65.0 30.8 34.2 (8) —
Total 100% $ 207.5 $ 89.8 $ 117.7 $ —
(1) The amounts disclosed reflect our target allocation based on the funded ratio of the plan at December 31, 2013 and are
subject to change based on the funded ratio of the plan during the year.
(2) See Note 2 - Fair value measurements for a description of the fair value hierarchy.
(3) Investments classified as Level 1 are valued at the readily available quoted price from an active market where there is
significant transparency in the executed quoted price. These investments consist of mutual funds valued at the net asset
value of shares held by the pension plan at year-end.
(4) Assets classified as Level 2 include units held in common collective trust funds and mutual funds, which are valued
based on the net asset values reported by the funds’ investment managers, and a short-term fixed income investment
fund which is valued using other significant observable inputs such as quoted prices for comparable securities.
(5) The plan holds units of the a hedge fund offered through a private placement. The units are valued monthly using a net
asset value (“NAV”). The hedge fund’s NAV is based on the fair value (reported NAVs) of each fund’s underlying fund
investments and includes cash equivalents, and any accrued payables or receivables. Both the hedge fund and its
underlying investments are priced using fair value pricing sources and techniques. The plan may redeem its shares
quarterly at the stated NAV after a one year lock-up.
(6) Consists of common collective trusts that invest in common stock of S&P 500 companies and US large-cap common
stock.
(7) Consists of a common collective trust that invests in US mid-cap common stock.
(8) Primarily consists of a common collective trust that invests in passive bond market index lending funds and a short-
term investment fund.
(9) The inclusion of hedge funds serves to further diversify the fund and the volatility of the hedge fund portfolio returns
are expected to be less than that of global equities.