Express Scripts 2013 Annual Report Download - page 39
Download and view the complete annual report
Please find page 39 of the 2013 Express Scripts annual report below. You can navigate through the pages in the report by either clicking on the pages listed below, or by using the keyword search tool below to find specific information within the annual report.-
 1
1 -
2
-
3
-
4
-
5
-
6
-
7
-
8
-
9
-
10
-
11
-
12
-
13
-
14
-
15
-
16
-
17
-
18
-
19
-
20
-
21
-
22
-
23
-
24
-
25
-
26
-
27
-
28
-
 29
29 -
 30
30 -
 31
31 -
 32
32 -
 33
33 -
 34
34 -
 35
35 -
 36
36 -
 37
37 -
 38
38 -
 39
39 -
 40
40 -
 41
41 -
 42
42 -
 43
43 -
 44
44 -
 45
45 -
 46
46 -
 47
47 -
 48
48 -
 49
49 -
50
-
51
-
52
-
53
-
54
-
55
-
56
-
57
-
58
-
59
-
60
-
61
-
62
-
63
-
64
-
65
-
66
-
67
-
68
-
69
-
70
-
71
-
72
-
73
-
74
-
75
-
76
-
77
-
78
-
79
-
80
-
81
-
82
-
83
-
84
-
85
-
86
-
87
-
88
-
89
-
90
-
91
-
92
-
93
-
94
-
95
-
96
-
97
-
98
-
99
-
100
-
101
-
102
-
103
-
104
-
105
-
106
-
107
-
108
-
109
-
110
-
111
-
112
-
113
-
114
-
115
-
116
-
117
-
118
-
119
-
120
-
121
-
122
-
123
-
124
 |
 |

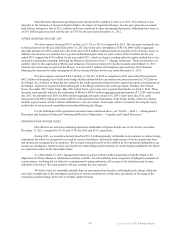
39 Express Scripts 2013 Annual Report
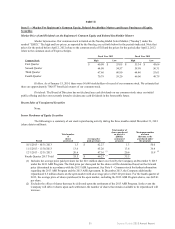
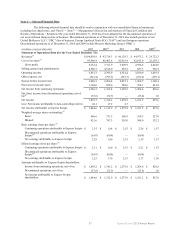
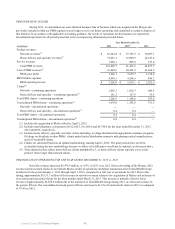
We have provided below a reconciliation of Adjusted EBITDA from continuing operations attributable to Express
Scripts to net income attributable to Express Scripts as we believe it is the most directly comparable measure calculated under
accounting principles generally accepted in the United States:
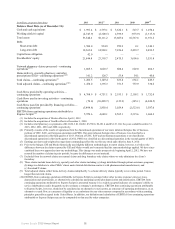
EBITDA from continuing operations attributable to Express Scripts
Year Ended December 31,
(in millions, except per claim data) 2013 2012 2011 2010 2009
Net income attributable to Express Scripts $ 1,844.6 $ 1,312.9 $ 1,275.8 $ 1,181.2 $ 827.6
Net (income) loss from discontinued operations, net of
tax 53.6 32.3 — 23.4 (1.0)
Net income from continuing operations 1,898.2 1,345.2 1,275.8 1,204.6 826.6
Income taxes 1,104.0 838.0 748.6 704.1 481.8
Depreciation and amortization 2,447.0 1,871.4 253.4 244.7 106.7
Interest expense, net 554.2 608.4 287.3 162.2 189.1
Equity income from joint venture (32.8)(14.9)———
EBITDA from continuing operations attributable to
Express Scripts 5,970.6 4,648.1 2,565.1 2,315.6 1,604.2
Adjustments to EBITDA from continuing operations
attributable to Express Scripts
Transaction and integration costs(1) 693.6 755.1 62.5 122.6 68.6
Accrual related to client contractual dispute ——30.0——
Benefit related to client contract amendment ———
(30.0)—
Legal settlement ————35.0
Benefit from insurance recovery ————
(15.0)
Adjusted EBITDA from continuing operations
attributable to Express Scripts 6,664.2 5,403.2 2,657.6 2,408.2 1,692.8
Adjusted EBITDA from continuing operations
attributable to Express Scripts per adjusted claim(2) $ 4.51 $ 3.87 $ 3.54 $ 3.19 $ 3.19
(1) Transaction and integration cost for the year ended December 31, 2013 presented above excludes $31.6 million of depreciation
related to the integration of Medco which does not impact EBITDA from continuing operations attributable to Express Scripts.
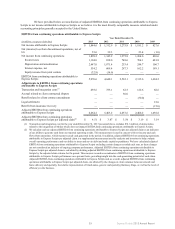
(2) We calculate and use adjusted EBITDA from continuing operations attributable to Express Scripts per adjusted claim as an indicator
of our ability to generate cash from our reported operating results. This measurement is used in concert with net income and cash
flows from operations, which measure actual cash generated in the period. In addition, adjusted EBITDA from continuing operations
attributable to Express Scripts per adjusted claim is a supplemental measurement used by analysts and investors to help evaluate
overall operating performance and our ability to incur and service debt and make capital expenditures. We have calculated adjusted
EBITDA from continuing operations attributable to Express Scripts excluding certain charges recorded each year, as these charges
are not considered an indicator of ongoing company performance. Adjusted EBITDA from continuing operations attributable to
Express Scripts per adjusted claim is calculated by dividing adjusted EBITDA from continuing operations attributable to Express
Scripts by the adjusted claim volume for the period. This measure is used as an indicator of EBITDA from continuing operations
attributable to Express Scripts performance on a per-unit basis, providing insight into the cash-generating potential of each claim.
Adjusted EBITDA from continuing operations attributable to Express Scripts and, as a result, adjusted EBITDA from continuing
operations attributable to Express Scripts per adjusted claim, are affected by the changes in claim volumes between network and
home delivery and specialty, the relative representation of brand-name, generic and specialty pharmacy drugs, as well as the level of
efficiency in the business.