Express Scripts 2013 Annual Report Download - page 109
Download and view the complete annual report
Please find page 109 of the 2013 Express Scripts annual report below. You can navigate through the pages in the report by either clicking on the pages listed below, or by using the keyword search tool below to find specific information within the annual report.-
 1
1 -
2
-
3
-
4
-
5
-
6
-
7
-
8
-
9
-
10
-
11
-
12
-
13
-
14
-
15
-
16
-
17
-
18
-
19
-
20
-
21
-
22
-
23
-
24
-
25
-
26
-
27
-
28
-
29
-
30
-
31
-
32
-
33
-
34
-
35
-
36
-
37
-
38
-
39
-
40
-
41
-
42
-
43
-
44
-
45
-
46
-
47
-
48
-
49
-
50
-
51
-
52
-
53
-
54
-
55
-
56
-
57
-
58
-
59
-
60
-
61
-
62
-
63
-
64
-
65
-
66
-
67
-
68
-
69
-
70
-
71
-
72
-
73
-
74
-
75
-
76
-
77
-
78
-
79
-
80
-
81
-
82
-
83
-
84
-
85
-
86
-
87
-
88
-
89
-
90
-
91
-
92
-
93
-
94
-
95
-
96
-
97
-
98
-
 99
99 -
 100
100 -
 101
101 -
 102
102 -
 103
103 -
 104
104 -
 105
105 -
 106
106 -
 107
107 -
 108
108 -
 109
109 -
 110
110 -
 111
111 -
 112
112 -
 113
113 -
 114
114 -
 115
115 -
 116
116 -
 117
117 -
 118
118 -
 119
119 -
120
-
121
-
122
-
123
-
124
 |
 |

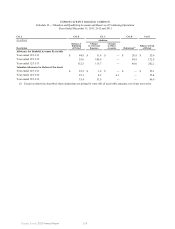
109 Express Scripts 2013 Annual Report
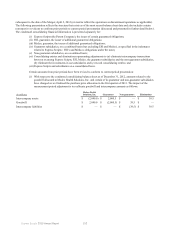
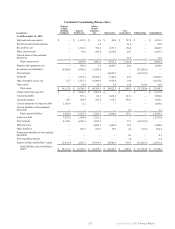
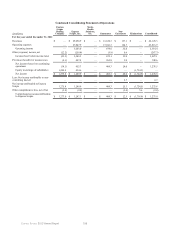
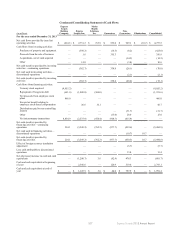
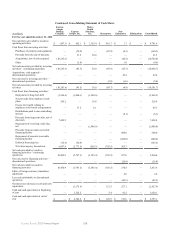
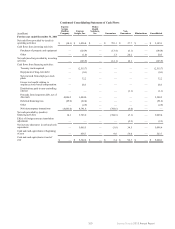
Condensed Consolidating Statement of Cash Flows
(in millions)
Express
Scripts
Holding
Company
Express
Scripts, Inc.
Medco
Health
Solutions,
Inc. Guarantors
Non-
Guarantors Eliminations Consolidated
For the year ended December 31, 2011
Net cash flows provided by (used in)
operating activities $ (14.1) $ 1,426.4 $ — $ 753.1 $ 27.7 $ — $ 2,193.1
Cash flows from investing activities:
Purchases of property and equipment — (124.9) — (13.4) (6.1) — (144.4)
Other — (1.0) — 1.3 20.2 — 20.5
Net cash (used in) provided by investing
activities — (125.9) — (12.1) 14.1 — (123.9)
Cash flows from financing activities:
Treasury stock acquired — (2,515.7) ————(2,515.7)
Repayment of long-term debt — (0.1) ————(0.1)
Net proceeds from employee stock
plans —32.2————32.2
Excess tax benefit relating to
employee stock-based compensation —28.3————28.3
Distributions paid to non-controlling
interest ————(1.1) — (1.1)
Proceeds from long-term debt, net of
discounts 4,086.3 1,494.0————5,580.3
Deferred financing fees (29.2) (62.4) ————(91.6)
Other — (2.9) ————(2.9)
Net intercompany transactions (4,043.0) 4,791.6 — (744.6) (4.0) — —
Net cash provided by (used in)
financing activities 14.1 3,765.0 — (744.6) (5.1) — 3,029.4
Effect of foreign currency translation
adjustment ————(2.2) — (2.2)
Net increase (decrease) in cash and cash
equivalents — 5,065.5 — (3.6) 34.5 — 5,096.4
Cash and cash equivalents at beginning
of year — 456.7 — 9.0 58.0 — 523.7
Cash and cash equivalents at end of
year $ — $ 5,522.2 $ — $ 5.4 $ 92.5 $ — $ 5,620.1