Express Scripts 2013 Annual Report Download - page 64
Download and view the complete annual report
Please find page 64 of the 2013 Express Scripts annual report below. You can navigate through the pages in the report by either clicking on the pages listed below, or by using the keyword search tool below to find specific information within the annual report.-
 1
1 -
2
-
3
-
4
-
5
-
6
-
7
-
8
-
9
-
10
-
11
-
12
-
13
-
14
-
15
-
16
-
17
-
18
-
19
-
20
-
21
-
22
-
23
-
24
-
25
-
26
-
27
-
28
-
29
-
30
-
31
-
32
-
33
-
34
-
35
-
36
-
37
-
38
-
39
-
40
-
41
-
42
-
43
-
44
-
45
-
46
-
47
-
48
-
49
-
50
-
51
-
52
-
53
-
 54
54 -
 55
55 -
 56
56 -
 57
57 -
 58
58 -
 59
59 -
 60
60 -
 61
61 -
 62
62 -
 63
63 -
 64
64 -
 65
65 -
 66
66 -
 67
67 -
 68
68 -
 69
69 -
 70
70 -
 71
71 -
 72
72 -
 73
73 -
 74
74 -
75
-
76
-
77
-
78
-
79
-
80
-
81
-
82
-
83
-
84
-
85
-
86
-
87
-
88
-
89
-
90
-
91
-
92
-
93
-
94
-
95
-
96
-
97
-
98
-
99
-
100
-
101
-
102
-
103
-
104
-
105
-
106
-
107
-
108
-
109
-
110
-
111
-
112
-
113
-
114
-
115
-
116
-
117
-
118
-
119
-
120
-
121
-
122
-
123
-
124
 |
 |

Express Scripts 2013 Annual Report 64
reclassified to claims and rebates payable, accounts payable and accrued expenses, as appropriate, at December 31, 2013 and
2012, respectively. This reclassification restores balances to cash and current liabilities for liabilities to our vendors which have
not been settled. No overdraft or unsecured short-term loan exists in relation to these negative balances.
We have restricted cash and investments in the amount of $22.8 million and $19.6 million at December 31, 2013
and 2012, respectively. These amounts consist of investments and cash, which include employers’ pre-funding amounts,
amounts restricted for state insurance licensure purposes and amounts restricted for the group purchasing organization.
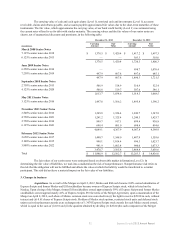
Accounts receivable. Based on our revenue recognition policies discussed below, certain claims at the end of each
period are unbilled. Revenue and unbilled receivables for those claims are estimated each period based on the billable amount
that is applied to the claim at the time of adjudication. That calculation is completed based on the pricing setup agreed upon
with each client. Estimates are adjusted to actual at the time of billing. Historically, adjustments to our original estimates have
been immaterial. As of December 31, 2013 and 2012, unbilled receivables were $2,618.3 million and $1,792.0 million,
respectively. Unbilled receivables are typically billed to clients within 30 days based on the contractual billing schedule agreed
upon with the client.
We provide an allowance for doubtful accounts equal to estimated uncollectible receivables. This estimate is based
on the current status of each customer’s receivable balance as well as current economic and market conditions. Receivables are
written off against the allowance only upon determination that such amounts are not recoverable and all collection attempts
have failed. Our allowance for doubtful accounts also reflects amounts associated with member premiums for the Company’s
Medicare Part D product offerings and amounts for certain supplies reimbursed by government agencies and insurance
companies. We regularly review and analyze the adequacy of these allowances based on a variety of factors, including the age
of the outstanding receivable and the collection history. When circumstances related to specific collection patterns change,
estimates of the recoverability of receivables are adjusted.
As of December 31, 2013 and 2012, we have an allowance for doubtful accounts for continuing operations of
$202.2 million and $132.5 million, respectively. As a percent of accounts receivable, our allowance for doubtful accounts for
continuing operations was 4.8% and 2.4% at December 31, 2013 and 2012, respectively. The increase in the allowance for
doubtful accounts is driven by the current status of aged balances of certain of our products and services that tend to have
longer collection periods.
The Company is a provider to State of Illinois employees. As of December 31, 2013 and 2012, the Company had
an outstanding receivable balance of approximately $320.1 million and $308.4 million, respectively, from the State of Illinois.
The Company has not recorded a reserve against this receivable, as it is associated with a State, which continues to make
payments. The Company believes that the full receivable balance will be realized.
Inventories. Inventories consist of prescription drugs and medical supplies which are stated at the lower of first-in
first-out cost or market.
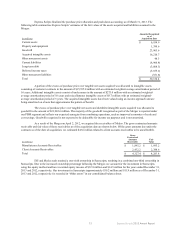
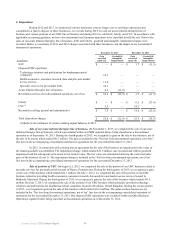
Property and equipment. Property and equipment is carried at cost and is depreciated using the straight-line
method over estimated useful lives of 7 years for furniture and 3 years to 5 years for equipment and purchased computer
software. Buildings are amortized on a straight-line basis over estimated useful lives of 10 to 35 years. Leasehold
improvements are amortized on a straight-line basis over the remaining term of the lease or the useful life of the asset, if
shorter. Expenditures for repairs, maintenance and renewals are charged to income as incurred. Expenditures that improve an
asset or extend its estimated useful life are capitalized. When properties are retired or otherwise disposed of, the related cost
and accumulated depreciation are removed from the accounts and any gain or loss is included in income.
Research and development expenditures relating to the development of software for internal purposes are charged
to expense until technological feasibility is established. Thereafter, the remaining software production costs up to the date
placed into production are capitalized and included as property and equipment. Amortization of the capitalized amounts
commences on the date placed into production and is computed on a product-by-product basis using the straight-line method
over the remaining estimated economic life of the product but not more than 5 years. Reductions, if any, in the carrying value
of capitalized software costs to net realizable value are expensed. With respect to capitalized software costs, we recorded
amortization expense of $205.0 million in 2013, $137.6 million in 2012 and $26.2 million in 2011.
Marketable securities. All investments not included as cash and cash equivalents are accounted for in accordance
with applicable accounting guidance for investments in debt and equity securities. Management determines the appropriate
classification of our marketable securities at the time of purchase and re-evaluates such determination at each balance sheet
date. All marketable securities at December 31, 2013 and 2012 were recorded in other noncurrent assets on our consolidated
balance sheet (see Note 2 - Fair value measurements).