Express Scripts 2013 Annual Report Download - page 41
Download and view the complete annual report
Please find page 41 of the 2013 Express Scripts annual report below. You can navigate through the pages in the report by either clicking on the pages listed below, or by using the keyword search tool below to find specific information within the annual report.-
 1
1 -
2
-
3
-
4
-
5
-
6
-
7
-
8
-
9
-
10
-
11
-
12
-
13
-
14
-
15
-
16
-
17
-
18
-
19
-
20
-
21
-
22
-
23
-
24
-
25
-
26
-
27
-
28
-
29
-
30
-
 31
31 -
 32
32 -
 33
33 -
 34
34 -
 35
35 -
 36
36 -
 37
37 -
 38
38 -
 39
39 -
 40
40 -
 41
41 -
 42
42 -
 43
43 -
 44
44 -
 45
45 -
 46
46 -
 47
47 -
 48
48 -
 49
49 -
 50
50 -
 51
51 -
52
-
53
-
54
-
55
-
56
-
57
-
58
-
59
-
60
-
61
-
62
-
63
-
64
-
65
-
66
-
67
-
68
-
69
-
70
-
71
-
72
-
73
-
74
-
75
-
76
-
77
-
78
-
79
-
80
-
81
-
82
-
83
-
84
-
85
-
86
-
87
-
88
-
89
-
90
-
91
-
92
-
93
-
94
-
95
-
96
-
97
-
98
-
99
-
100
-
101
-
102
-
103
-
104
-
105
-
106
-
107
-
108
-
109
-
110
-
111
-
112
-
113
-
114
-
115
-
116
-
117
-
118
-
119
-
120
-
121
-
122
-
123
-
124
 |
 |

41 Express Scripts 2013 Annual Report
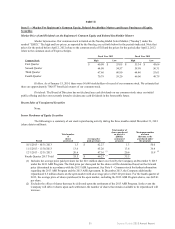
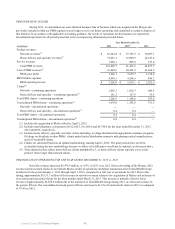
EXECUTIVE SUMMARY AND TREND FACTORS AFFECTING THE BUSINESS
Our results in 2013 compared to prior periods continue to be driven by the addition of Medco to our book of
business on April 2, 2012. The Merger impacted all components of our financial statements, including our revenues, expenses
and profits, the consolidated balance sheet and claims volumes. Our results reflect the ability to successfully achieve synergies
throughout the Merger. Our results also reflect the successful execution of our business model, which emphasizes the alignment
of our financial interests with those of our clients and patients through greater use of generics and low-cost brands, home
delivery and specialty pharmacies. We also benefited from better management of ingredient costs through renegotiation of
supplier contracts, increased competition among generic manufacturers and a higher generic fill rate (80.8% in 2013 compared
to 78.5% in 2012). In addition, we are providing our clients with additional tools designed to generate higher generic fill rates,
further increase the use of our home delivery and specialty pharmacy services and drive greater adherence. While we operate in
a competitive environment with various marketplace forces that affect pricing and plan structures and increasing client
demands and expectations, we expect that the ongoing positive trends in our business will continue to offset negative factors.
As a result of the transition of UnitedHealth Group claims and variability of other contractual revenue streams, quarterly
performance trends may vary from historical periods. As expected, revenue related to a large client was realized in the second
quarter of 2013 due to the structure of the contract. The Company anticipates this pattern of earnings to continue for the
foreseeable future.
As the regulatory environment evolves, we plan to continue to make significant investments designed to keep us
ahead of the competition. These projects include preparation for changes to the Medicare regulations and the implementation of
the Health Reform Laws.
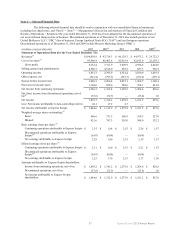
CRITICAL ACCOUNTING POLICIES
The preparation of financial statements in conformity with accounting principles generally accepted in the United
States requires management to make estimates and assumptions that affect the reported amounts of assets and liabilities at the
date of the financial statements and the reported amounts of revenues and expenses during the reporting period. Our estimates
and assumptions are based upon a combination of historical information and various other assumptions believed to be
reasonable under the particular circumstances. Actual results may differ from our estimates. The accounting policies described
below represent those policies that management believes most impact our consolidated financial statements, are important for
an understanding of our results of operations or require management to make difficult, subjective or complex judgments. This
should be read in conjunction with Note 1 - Summary of significant accounting policies and with the other notes to the
consolidated financial statements.
GOODWILL AND INTANGIBLE ASSETS
ACCOUNTING POLICY
Goodwill and intangible asset balances arise primarily from the allocation of the purchase price of businesses
acquired based on the fair market value of assets acquired and liabilities assumed on the date of the acquisition. Goodwill is
evaluated for impairment annually or when events or circumstances occur indicating that goodwill might be impaired. We
determine reporting units based on component parts of our business one level below the segment level. Our reporting units
represent businesses for which discrete financial information is available and reviewed regularly by segment management.
Guidance related to goodwill impairment testing provides an option to first assess qualitative factors to determine
whether it is more likely than not that the fair value of a reporting unit is less than its carrying amount. If we perform a
qualitative assessment, the Company considers various events and circumstances when evaluating whether it is more likely
than not that the fair value of a reporting unit is less than its carrying amount and whether the first step of the goodwill
impairment test (“Step 1”) is necessary.
If we perform Step 1, the measurement of possible impairment would be based on a comparison of the fair value of
each reporting unit to the carrying value of the reporting unit’s net assets. Impairment losses, if any, would be determined based
on the fair value of the individual assets and liabilities of the reporting unit, using discount rates that reflect the inherent risk of
the underlying business. We would record an impairment charge to the extent the carrying value of goodwill exceeds the
implied fair value of goodwill resulting from this calculation. This valuation process involves assumptions based upon
management’s best estimates and judgments that approximate the market conditions experienced for our reporting units at the
time the impairment assessment is made. Actual results may differ from these estimates due to the inherent uncertainty
involved in such estimates.