Express Scripts 2013 Annual Report Download - page 38
Download and view the complete annual report
Please find page 38 of the 2013 Express Scripts annual report below. You can navigate through the pages in the report by either clicking on the pages listed below, or by using the keyword search tool below to find specific information within the annual report.-
 1
1 -
2
-
3
-
4
-
5
-
6
-
7
-
8
-
9
-
10
-
11
-
12
-
13
-
14
-
15
-
16
-
17
-
18
-
19
-
20
-
21
-
22
-
23
-
24
-
25
-
26
-
27
-
 28
28 -
 29
29 -
 30
30 -
 31
31 -
 32
32 -
 33
33 -
 34
34 -
 35
35 -
 36
36 -
 37
37 -
 38
38 -
 39
39 -
 40
40 -
 41
41 -
 42
42 -
 43
43 -
 44
44 -
 45
45 -
 46
46 -
 47
47 -
 48
48 -
49
-
50
-
51
-
52
-
53
-
54
-
55
-
56
-
57
-
58
-
59
-
60
-
61
-
62
-
63
-
64
-
65
-
66
-
67
-
68
-
69
-
70
-
71
-
72
-
73
-
74
-
75
-
76
-
77
-
78
-
79
-
80
-
81
-
82
-
83
-
84
-
85
-
86
-
87
-
88
-
89
-
90
-
91
-
92
-
93
-
94
-
95
-
96
-
97
-
98
-
99
-
100
-
101
-
102
-
103
-
104
-
105
-
106
-
107
-
108
-
109
-
110
-
111
-
112
-
113
-
114
-
115
-
116
-
117
-
118
-
119
-
120
-
121
-
122
-
123
-
124
 |
 |

Express Scripts 2013 Annual Report 38
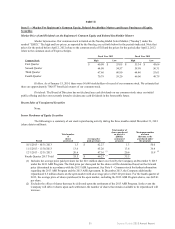
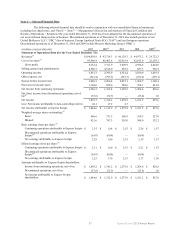
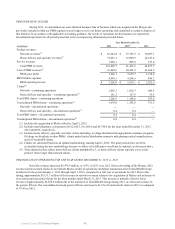
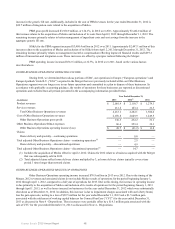
(in millions, except per share data) 2013 2012(1) 2011 2010 2009(2)
Balance Sheet Data (as of December 31):
Cash and cash equivalents $ 1,991.4 $ 2,793.1 $ 5,620.1 $ 523.7 $ 1,070.4
Working (deficit) capital (4,743.9)(2,300.5) 2,599.9 (975.9)(1,313.3)
Total assets 53,548.2 58,111.2 15,607.0 10,557.8 11,931.2
Debt:
Short-term debt 1,584.0 934.9 999.9 0.1 1,340.1
Long-term debt 12,363.0 14,980.1 7,076.4 2,493.7 2,492.5
Capital lease obligation 42.0————
Stockholders’ equity 21,844.8 23,395.7 2,475.3 3,606.6 3,551.8
Network pharmacy claims processed—continuing
operations(6)(7) 1,065.3 1,020.7 600.4 602.0 404.3
Home delivery, specialty pharmacy, and other
prescriptions filled—continuing operations(6)(8) 141.2 128.7 53.4 54.1 45.0
Total claims—continuing operations(6) 1,206.5 1,149.4 653.8 656.1 449.3
Total adjusted claims—continuing operations(6)(9) 1,478.0 1,395.3 751.5 753.9 530.6
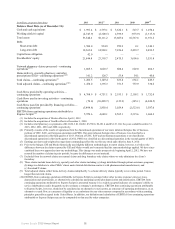
Cash flows provided by operating activities—
continuing operations $ 4,768.9 $ 4,751.1 $ 2,193.1 $ 2,105.1 $ 1,752.0
Cash flows used in investing activities—continuing
operations (70.0)(10,428.7)(123.9)(145.1)(4,820.5)
Cash flows (used in) provided by financing activities—
continuing operations (5,494.8) 2,850.4 3,029.4 (2,523.0) 3,587.0
EBITDA from continuing operations attributable to
Express Scripts(10) 5,970.6 4,648.1 2,565.1 2,315.6 1,604.2
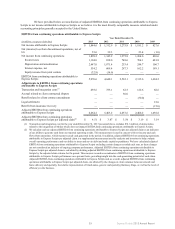
(1) Includes the acquisition of Medco effective April 2, 2012.
(2) Includes the acquisition of NextRx effective December 1, 2009.
(3) Includes retail pharmacy co-payments of $12,620.3, $11,668.6, $5,786.6, $6,181.4 and $3,132.1 for the years ended December 31,
2013, 2012, 2011, 2010 and 2009, respectively.
(4) Primarily consists of the results of operations from the discontinued operations of our acute infusion therapies line of business,
portions of UBC, EAV, our European operations and PMG. Our acute infusion therapies line of business was classified as a
discontinued operation in the third quarter of 2013. Portions of UBC, EAV and our European operations were classified as
discontinued operations in the fourth quarter of 2012. PMG was classified as a discontinued operation in the second quarter of 2010.
(5) Earnings per share and weighted-average shares outstanding reflect the two-for-one stock split effective June 8, 2010.
(6) Prior to the Merger, ESI and Medco historically used slightly different methodologies to report claims; however, we believe the
differences between the claims reported by ESI and Medco would not be material had the same methodology applied. We have since
combined these two approaches into one methodology. This change was made prospectively beginning April 2, 2012. We have not
restated the number of claims in prior periods, because the differences are not material.
(7) Excluded from the network claims are manual claims and drug formulary only claims where we only administer the client’s
formulary.
(8) These claims include home delivery, specialty and other claims including: (a) drugs distributed through patient assistance programs;
(b) drugs we distribute to other PBMs’ clients under limited distribution contracts with pharmaceutical manufacturers; and
(c) FreedomFP claims.
(9) Total adjusted claims reflect home delivery claims multiplied by 3, as home delivery claims typically cover a time period 3 times
longer than network claims.
(10) EBITDA from continuing operations attributable to Express Scripts is earnings before other income (expense), interest, taxes,
depreciation and amortization, or alternatively calculated as operating income plus depreciation and amortization. EBITDA from
continuing operations attributable to Express Scripts is presented because it is a widely accepted indicator of a company’s ability to
service indebtedness and is frequently used to evaluate a company’s performance. EBITDA from continuing operations attributable
to Express Scripts, however, should not be considered as an alternative to net income, as a measure of operating performance, as an
alternative to cash flow, as a measure of liquidity or as a substitute for any other measure computed in accordance with accounting
principles generally accepted in the United States. In addition, our definition and calculation of EBITDA from continuing operations
attributable to Express Scripts may not be comparable to that used by other companies.