Express Scripts 2013 Annual Report Download - page 51
Download and view the complete annual report
Please find page 51 of the 2013 Express Scripts annual report below. You can navigate through the pages in the report by either clicking on the pages listed below, or by using the keyword search tool below to find specific information within the annual report.-
 1
1 -
2
-
3
-
4
-
5
-
6
-
7
-
8
-
9
-
10
-
11
-
12
-
13
-
14
-
15
-
16
-
17
-
18
-
19
-
20
-
21
-
22
-
23
-
24
-
25
-
26
-
27
-
28
-
29
-
30
-
31
-
32
-
33
-
34
-
35
-
36
-
37
-
38
-
39
-
40
-
 41
41 -
 42
42 -
 43
43 -
 44
44 -
 45
45 -
 46
46 -
 47
47 -
 48
48 -
 49
49 -
 50
50 -
 51
51 -
 52
52 -
 53
53 -
 54
54 -
 55
55 -
 56
56 -
 57
57 -
 58
58 -
 59
59 -
 60
60 -
 61
61 -
62
-
63
-
64
-
65
-
66
-
67
-
68
-
69
-
70
-
71
-
72
-
73
-
74
-
75
-
76
-
77
-
78
-
79
-
80
-
81
-
82
-
83
-
84
-
85
-
86
-
87
-
88
-
89
-
90
-
91
-
92
-
93
-
94
-
95
-
96
-
97
-
98
-
99
-
100
-
101
-
102
-
103
-
104
-
105
-
106
-
107
-
108
-
109
-
110
-
111
-
112
-
113
-
114
-
115
-
116
-
117
-
118
-
119
-
120
-
121
-
122
-
123
-
124
 |
 |

51 Express Scripts 2013 Annual Report
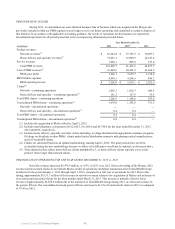
2012 due to acceleration of stock-based compensation expense and award vesting associated with the
termination of certain Medco employees following the Merger during the year ended 2012.
• Changes in working capital resulted in cash inflows of $775.4 million in 2013 compared to cash inflows of
$1,425.8 million over the same period in 2012, resulting in a total decrease of $650.4 million. The working
capital decrease was primarily due to the timing and receipt and payment of claims and rebates payable,
accounts receivable and accounts payable.
In 2013, net cash used in discontinued operations was $11.4 million, compared to $30.5 million provided by
discontinued operations in 2012, a decrease of $41.9 million. This was due to changes in working capital of our acute infusion
therapies line of business, portions of UBC, and our European operations in 2013.
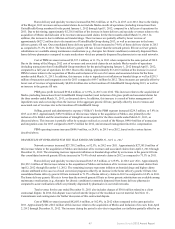
In 2012, net cash provided by continuing operations increased $2,558.0 million to $4,751.1 million. Changes in
operating cash flows from continuing operations in 2012 were impacted by the following factors:
• Net income from continuing operations increased $83.9 million in 2012 over 2011.
• Net income is reduced by depreciation and amortization expense, which is non-cash and therefore added back
to cash flows from operating activities to reconcile net income to net cash provided. Total depreciation and
amortization expense was $1,871.4 million in 2012, an increase of $1,618.0 million over 2011.
• Changes in working capital resulted in cash inflows of $1,425.8 million in 2012 compared to cash inflows of
$377.5 million over the same period in 2011, resulting in a total increase of $1,048.3 million. The cash flow
increase was primarily due to the timing and receipt and payment of claims and rebates payable, accounts
receivable and accounts payable as well as the realization of working capital synergies.
In 2012, net cash provided by discontinued operations increased $30.5 million. This was due to classification of
our acute infusion therapies line of business, portions of UBC, EAV and our European operations as discontinued operations in
2012, while no businesses classified as discontinued operations were owned in 2011.
As a percent of accounts receivable, our allowance for doubtful accounts for continuing operations was 4.8% and
2.4% at December 31, 2013 and 2012, respectively. The increase in the allowance for doubtful accounts is driven by the current
status of aged balances of certain of our products and services that tend to have longer collection periods.
In 2013, net cash used in investing activities by continuing operations decreased $10,358.7 million to $70.0
million. This change is primarily attributable to $10,326.0 million of cash outflows associated with the Merger during 2012.
Capital expenditures for purchases of property and equipment increased $262.8 million compared to the prior period due
primarily to integration-related investments. We intend to continue to invest in infrastructure and technology, which we believe
will provide efficiencies in operations, facilitate growth and enhance the service we provide to our clients. Anticipated capital
expenditures will be funded primarily from operating cash flow or, to the extent necessary, with borrowings under our
revolving credit facility, discussed below. The proceeds from the sale of discontinued operations of $356.9 million offset capital
expenditures for the year ended December 31, 2013.
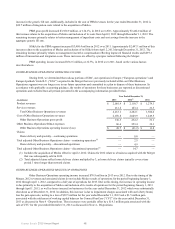
Net cash used in financing activities by continuing operations decreased $8,345.2 million from inflows of $2,850.4
million for the year ended December 31, 2012 to outflows of $5,494.8 million for the year ended December 31, 2013. Outflows
in 2013 were primarily due to treasury share repurchases of $4,055.2 million, $1,300.0 million related to the redemption of
senior notes and $631.6 million of quarterly term facility payments during the year ended December 31, 2013. These net
outflows are compared to proceeds of $3,458.9 million from the issuance of senior notes, proceeds of $4,000.0 million in
connection with the term facility used to fund the Merger which were received during the year ended December 31, 2012, and
repayments of long-term debt totaling $4,868.5 million.
In 2012, net cash used in financing activities by discontinued operations increased by $26.8 million due to
classification of EAV as discontinued operations in 2012, while no businesses were classified in discontinued operations in
2011. There were no cash flows for financing activities by discontinued operations during 2013.
At December 31, 2013, our sources of capital included a $1,500.0 million revolving credit facility (the “revolving
facility”) (none of which was outstanding at December 31, 2013).
Our current maturities of long-term debt include approximately $900.0 million of senior notes, as well as $684.2
million of term loan payments that are due in 2014.
The Company is a provider to State of Illinois employees. As of December 31, 2013 and 2012, the Company had
an outstanding receivable balance of approximately $320.1 million and $308.4 million, respectively, from the State of Illinois.
The Company has not recorded a reserve against this receivable, as it is associated with a State, which continues to make
payments. The Company believes that the full receivable balance will be realized.