Express Scripts 2013 Annual Report Download - page 101
Download and view the complete annual report
Please find page 101 of the 2013 Express Scripts annual report below. You can navigate through the pages in the report by either clicking on the pages listed below, or by using the keyword search tool below to find specific information within the annual report.-
 1
1 -
2
-
3
-
4
-
5
-
6
-
7
-
8
-
9
-
10
-
11
-
12
-
13
-
14
-
15
-
16
-
17
-
18
-
19
-
20
-
21
-
22
-
23
-
24
-
25
-
26
-
27
-
28
-
29
-
30
-
31
-
32
-
33
-
34
-
35
-
36
-
37
-
38
-
39
-
40
-
41
-
42
-
43
-
44
-
45
-
46
-
47
-
48
-
49
-
50
-
51
-
52
-
53
-
54
-
55
-
56
-
57
-
58
-
59
-
60
-
61
-
62
-
63
-
64
-
65
-
66
-
67
-
68
-
69
-
70
-
71
-
72
-
73
-
74
-
75
-
76
-
77
-
78
-
79
-
80
-
81
-
82
-
83
-
84
-
85
-
86
-
87
-
88
-
89
-
90
-
 91
91 -
 92
92 -
 93
93 -
 94
94 -
 95
95 -
 96
96 -
 97
97 -
 98
98 -
 99
99 -
 100
100 -
 101
101 -
 102
102 -
 103
103 -
 104
104 -
 105
105 -
 106
106 -
 107
107 -
 108
108 -
 109
109 -
 110
110 -
 111
111 -
112
-
113
-
114
-
115
-
116
-
117
-
118
-
119
-
120
-
121
-
122
-
123
-
124
 |
 |

101 Express Scripts 2013 Annual Report
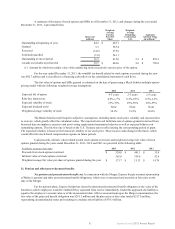
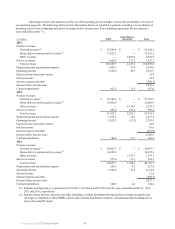
Quarters
(in millions, except per share data) First Second(3) Third Fourth
Fiscal 2012(1)
Total revenues(2) $ 12,132.6 $ 27,455.0 $ 26,761.6 $ 27,365.1
Cost of revenues(2) 11,300.6 25,375.7 24,658.7 25,067.4
Gross profit 832.0 2,079.3 2,102.9 2,297.7
Selling, general and administrative 265.1 1,579.9 1,282.2 1,390.8
Operating income 566.9 499.4 820.7 906.9
Net income from continuing operations 270.2 152.2 415.9 524.1
Net income (loss) from discontinued operations, net of tax — 0.8 (20.0)(13.1)
Net income $ 270.2 $ 153.0 $ 395.9 $ 511.0
Less: Net income attributable to non-controlling interest 2.4 3.4 4.5 6.9
Net income attributable to Express Scripts 267.8 149.6 391.4 504.1
Basic earnings (loss) per share
Continuing operations attributable to Express Scripts $ 0.55 $ 0.18 $ 0.51 $ 0.63
Discontinued operations attributable to Express Scripts ——
(0.02)(0.02)
Net earnings attributable to Express Scripts 0.55 0.19 0.48 0.62
Diluted earnings (loss) per share attributable to Express
Scripts
Continuing operations attributable to Express Scripts $ 0.55 $ 0.18 $ 0.50 $ 0.62
Discontinued operations attributable to Express Scripts ——
(0.02)(0.02)
Net earnings attributable to Express Scripts 0.55 0.18 0.47 0.61
Amounts attributable to Express Scripts shareholders:
Income from continuing operations, net of tax $ 267.8 $ 148.8 $ 411.4 $ 517.2
Discontinued operations, net of tax — 0.8 (20.0)(13.1)
Net income attributable to Express Scripts shareholders $ 267.8 $ 149.6 $ 391.4 $ 504.1
(1) Adjusted to reflect the results of our acute infusion therapies line of business as discontinued.
(2) Includes retail pharmacy co-payments of $3,674.4 and $1,496.6 for the three months ended March 31, 2013 and 2012,
respectively, $3,204.3 and $3,519.1 for the three months ended June 30, 2013 and 2012, respectively, $2,966.5 and
$3,348.9 for the three months ended September 30, 2013 and 2012, respectively, and $2,775.1 and $3,304.0 for the
three months ended December 31, 2013 and 2012, respectively.
(3) Includes the April 2, 2012 acquisition of Medco.
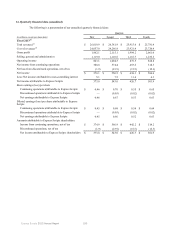
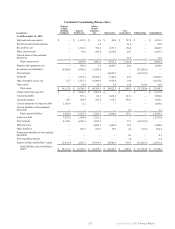
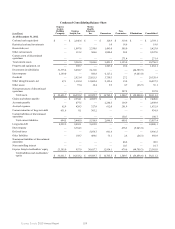
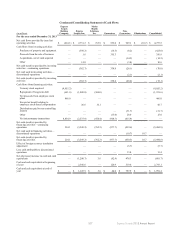
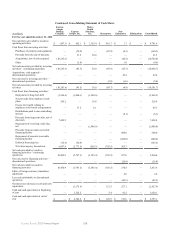
15. Condensed consolidating financial information
The senior notes issued by the Company, ESI and Medco are jointly and severally and fully and unconditionally
(subject to certain customary release provisions, including sale, exchange, transfer or liquidation of the guarantor subsidiary)
guaranteed by certain of our 100% owned domestic subsidiaries, other than certain regulated subsidiaries, and, with respect to
notes issued by ESI and Medco, by us. The following condensed consolidating financial information has been prepared in
accordance with the requirements for presentation of such information. The condensed consolidating financial information
presented below is not indicative of what the financial position, results of operations or cash flows would have been had each of
the entities operated as an independent company during the period for various reasons, including, but not limited to,
intercompany transactions and integration of systems.
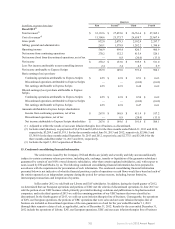
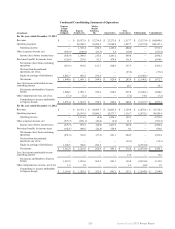
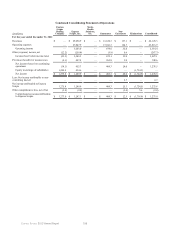
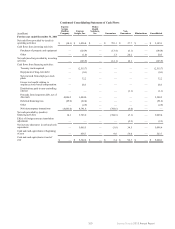
In December 2012 we sold both our Liberty and EAV subsidiaries. In addition, during the fourth quarter of 2012,
we determined that our European operations and portions of UBC met the criteria of discontinued operations. In June 2013 we
sold the portion of our UBC business which primarily provided technology solutions and publications to biopharmaceutical
companies, and in the third quarter of 2013 we sold the remaining portions of our UBC business that were classified as
discontinued. In the fourth quarter of 2013, we sold our acute infusion therapies line of business. Consequently, the operations
of EAV, our European operations, the portions of UBC operations that were sold, and our acute infusion therapies line of
business are included as discontinued operations of the non-guarantors as of and for the year ended December 31, 2013
(through their respective dates of sale, as applicable), and as of December 31, 2012. Results for the year ended December 31,
2012 include the operations of Liberty, EAV, our European operations, UBC and our acute infusion therapies line of business