Express Scripts 2013 Annual Report Download - page 46
Download and view the complete annual report
Please find page 46 of the 2013 Express Scripts annual report below. You can navigate through the pages in the report by either clicking on the pages listed below, or by using the keyword search tool below to find specific information within the annual report.-
 1
1 -
2
-
3
-
4
-
5
-
6
-
7
-
8
-
9
-
10
-
11
-
12
-
13
-
14
-
15
-
16
-
17
-
18
-
19
-
20
-
21
-
22
-
23
-
24
-
25
-
26
-
27
-
28
-
29
-
30
-
31
-
32
-
33
-
34
-
35
-
 36
36 -
 37
37 -
 38
38 -
 39
39 -
 40
40 -
 41
41 -
 42
42 -
 43
43 -
 44
44 -
 45
45 -
 46
46 -
 47
47 -
 48
48 -
 49
49 -
 50
50 -
 51
51 -
 52
52 -
 53
53 -
 54
54 -
 55
55 -
 56
56 -
57
-
58
-
59
-
60
-
61
-
62
-
63
-
64
-
65
-
66
-
67
-
68
-
69
-
70
-
71
-
72
-
73
-
74
-
75
-
76
-
77
-
78
-
79
-
80
-
81
-
82
-
83
-
84
-
85
-
86
-
87
-
88
-
89
-
90
-
91
-
92
-
93
-
94
-
95
-
96
-
97
-
98
-
99
-
100
-
101
-
102
-
103
-
104
-
105
-
106
-
107
-
108
-
109
-
110
-
111
-
112
-
113
-
114
-
115
-
116
-
117
-
118
-
119
-
120
-
121
-
122
-
123
-
124
 |
 |

Express Scripts 2013 Annual Report 46
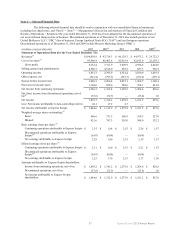
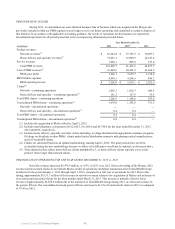
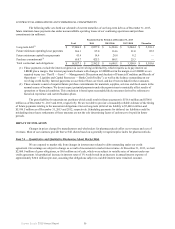
PBM OPERATING INCOME
During 2013, we determined our acute infusion therapies line of business which was acquired in the Merger and
previously included within our PBM segment was no longer core to our future operations and committed to a plan to dispose of
this business. In accordance with applicable accounting guidance, the results of operations for this business are reported as
discontinued operations for all periods presented in the accompanying information provided below.
Year Ended December 31,
(in millions) 2013 2012(1) 2011
Product revenues:
Network revenues(2) $ 63,244.4 $ 57,765.5 $ 30,007.3
Home delivery and specialty revenues(3) 37,621.2 32,860.9 14,547.4
Service revenues 1,020.1 805.8 273.0
Total PBM revenues 101,885.7 91,432.2 44,827.7
Cost of PBM revenues(2) 93,889.6 84,352.5 41,668.9
PBM gross profit 7,996.1 7,079.7 3,158.8
PBM SG&A expenses 4,494.1 4,264.6 856.2
PBM operating income $ 3,502.0 $ 2,815.1 $ 2,302.6
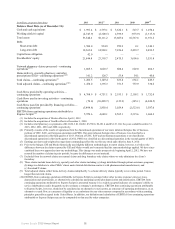
Claims(4)
Network—continuing operations 1,065.3 1,020.7 600.4
Home delivery and specialty—continuing operations(3) 141.2 127.9 53.4
Total PBM claims—continuing operations 1,206.5 1,148.6 653.8
Total adjusted PBM claims—continuing operations(5) 1,478.0 1,392.8 751.5
Network—discontinued operations ———
Home delivery and specialty—discontinued operations(3) 0.4 0.4 —
Total PBM claims—discontinued operations 0.4 0.4 —
Total adjusted PBM claims—discontinued operations(5) 0.4 0.4 —
(1) Includes the acquisition of Medco effective April 2, 2012.
(2) Includes retail pharmacy co-payments of $12,620.3, $11,668.6 and $5,786.6 for the years ended December 31, 2013,
2012 and 2011, respectively.
(3) Includes home delivery, specialty and other claims including: (a) drugs distributed through patient assistance programs;
(b) drugs we distribute to other PBMs’ clients under limited distribution contracts with pharmaceutical manufacturers;
and (c) FreedomFP claims.
(4) Claims are calculated based on an updated methodology starting April 2, 2012. The prior periods have not been
recalculated using the new methodology because we believe the differences would not be material, as discussed above.
(5) Total adjusted claims reflect home delivery claims multiplied by 3, as home delivery claims typically cover a time
period 3 times longer than network claims.
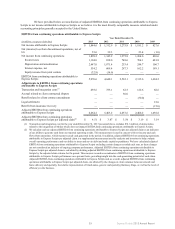
PBM RESULTS OF OPERATIONS FOR THE YEAR ENDED DECEMBER 31, 2013 vs. 2012
Network revenues increased $5,478.9 million, or 9.5%, in 2013 over 2012. Due to the timing of the Merger, 2012
revenues and associated claims do not include Medco results of operations (including transactions from UnitedHealth Group
members) for the period January 1, 2012 through April 1, 2012, compared to a full year of operations for 2013. Due to this
timing, approximately $9,131.7 million of the increase in network revenues relates to the acquisition of Medco and inclusion of
its revenues and associated claims for the three months ended March 31, 2013. This increase is partially offset by lower
revenue of approximately $3,565.8 million due to the transition of UnitedHealth Group during 2013, as well as an increase in
the generic fill rate. Our consolidated network generic fill rate increased to 81.6% of total network claims in 2013 as compared
to 79.4% in 2012.