Express Scripts 2013 Annual Report Download - page 48
Download and view the complete annual report
Please find page 48 of the 2013 Express Scripts annual report below. You can navigate through the pages in the report by either clicking on the pages listed below, or by using the keyword search tool below to find specific information within the annual report.-
 1
1 -
2
-
3
-
4
-
5
-
6
-
7
-
8
-
9
-
10
-
11
-
12
-
13
-
14
-
15
-
16
-
17
-
18
-
19
-
20
-
21
-
22
-
23
-
24
-
25
-
26
-
27
-
28
-
29
-
30
-
31
-
32
-
33
-
34
-
35
-
36
-
37
-
 38
38 -
 39
39 -
 40
40 -
 41
41 -
 42
42 -
 43
43 -
 44
44 -
 45
45 -
 46
46 -
 47
47 -
 48
48 -
 49
49 -
 50
50 -
 51
51 -
 52
52 -
 53
53 -
 54
54 -
 55
55 -
 56
56 -
 57
57 -
 58
58 -
59
-
60
-
61
-
62
-
63
-
64
-
65
-
66
-
67
-
68
-
69
-
70
-
71
-
72
-
73
-
74
-
75
-
76
-
77
-
78
-
79
-
80
-
81
-
82
-
83
-
84
-
85
-
86
-
87
-
88
-
89
-
90
-
91
-
92
-
93
-
94
-
95
-
96
-
97
-
98
-
99
-
100
-
101
-
102
-
103
-
104
-
105
-
106
-
107
-
108
-
109
-
110
-
111
-
112
-
113
-
114
-
115
-
116
-
117
-
118
-
119
-
120
-
121
-
122
-
123
-
124
 |
 |

Express Scripts 2013 Annual Report 48
increase in the generic fill rate. Additionally, included in the cost of PBM revenues for the year ended December 31, 2012 is
$49.7 million of integration costs related to the acquisition of Medco.
PBM gross profit increased $3,920.9 million, or 124.1%, in 2012 over 2011. Approximately $3,422.0 million of
this increase relates to the acquisition of Medco and inclusion of its costs from April 2, 2012 through December 31, 2012. The
remaining increase primarily relates to better management of ingredient costs and cost savings from the increase in the
aggregate generic fill rate.
SG&A for the PBM segment increased $3,408.4 million in 2012 over 2011. Approximately $2,497.1 million of this
increase relates to the acquisition of Medco and inclusion of its SG&A from April 2, 2012 through December 31, 2012. The
remaining increase primarily relates to management incentive compensation reflecting improved financial results and $697.2
million of transaction and integration costs. These increases are offset by synergies realized following the Merger.
PBM operating income increased $512.5 million, or 22.3%, in 2012 over 2011, based on the various factors
described above.
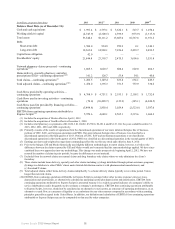
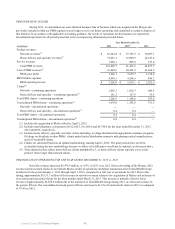
OTHER BUSINESS OPERATIONS OPERATING INCOME
During 2012, we determined that various portions of UBC, our operations in Europe (“European operations”) and
Europa Apotheek Venlo B.V. (“EAV”) acquired in the Merger that were previously included within our Other Business
Operations segment were no longer core to our future operations and committed to a plan to dispose of these businesses. In
accordance with applicable accounting guidance, the results of operations for these businesses are reported as discontinued
operations and excluded from all periods presented in the accompanying information provided below.
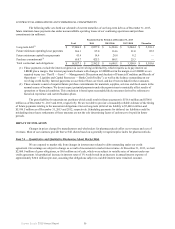
Year Ended December 31,
(in millions) 2013 2012(1) 2011
Product revenues $ 2,001.9 $ 2,118.7 $ 1,279.3
Service revenues 211.2 163.4 21.3
Total Other Business Operations revenues 2,213.1 2,282.1 1,300.6
Cost of Other Business Operations revenues 2,076.8 2,049.9 1,249.5
Other Business Operations gross profit 136.3 232.2 51.1
Other Business Operations SG&A expenses 86.6 253.4 39.3
Other Business Operations operating income (loss) $ 49.7 $ (21.2) $ 11.8
Claims
Home delivery and specialty—continuing operations — 0.8 —
Total adjusted Other Business Operations claims—continuing operations(2) — 2.5 —
Home delivery and specialty—discontinued operations — 4.9 —
Total adjusted Other Business Operations claims—discontinued operations(2) — 14.7 —
(1) Includes the acquisition of Medco effective April 2, 2012. Claims for 2012 relate to a business acquired with the Merger
that was subsequently sold in 2012.
(2) Total adjusted claims reflect home delivery claims multiplied by 3, as home delivery claims typically cover a time
period 3 times longer than network claims.
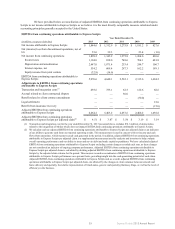
OTHER BUSINESS OPERATIONS RESULTS OF OPERATIONS
Other Business Operations operating income increased $70.9 million in 2013 over 2012. Due to the timing of the
Merger, 2012 revenues and associated claims do not include Medco results of operations for the period beginning January 1,
2012 through April 1, 2012, compared to a full year of operations for 2013. Due to this timing, the increase in operating income
is due primarily to the acquisition of Medco and inclusion of its results of operations for the period beginning January 1, 2013
through April 1, 2013, as well as losses incurred on businesses for the year ended December 31, 2012 which were substantially
shut down as of December 31, 2012. In addition, this increase is due to impairment charges associated with our Liberty brand,
less the gain upon sale, netting to a loss of $22.5 million for the year ended December 31, 2012 and a $3.5 million gain
associated with the settlement of working capital balances for ConnectYourCare (“CYC”) for the year ended December 31,
2013 as discussed in Note 4 - Dispositions. These increases were partially offset by a $14.3 million gain associated with the
sale of CYC for the year ended December 31, 2012 as discussed in Note 4 - Dispositions.