Express Scripts 2013 Annual Report Download - page 61
Download and view the complete annual report
Please find page 61 of the 2013 Express Scripts annual report below. You can navigate through the pages in the report by either clicking on the pages listed below, or by using the keyword search tool below to find specific information within the annual report.-
 1
1 -
2
-
3
-
4
-
5
-
6
-
7
-
8
-
9
-
10
-
11
-
12
-
13
-
14
-
15
-
16
-
17
-
18
-
19
-
20
-
21
-
22
-
23
-
24
-
25
-
26
-
27
-
28
-
29
-
30
-
31
-
32
-
33
-
34
-
35
-
36
-
37
-
38
-
39
-
40
-
41
-
42
-
43
-
44
-
45
-
46
-
47
-
48
-
49
-
50
-
 51
51 -
 52
52 -
 53
53 -
 54
54 -
 55
55 -
 56
56 -
 57
57 -
 58
58 -
 59
59 -
 60
60 -
 61
61 -
 62
62 -
 63
63 -
 64
64 -
 65
65 -
 66
66 -
 67
67 -
 68
68 -
 69
69 -
 70
70 -
 71
71 -
72
-
73
-
74
-
75
-
76
-
77
-
78
-
79
-
80
-
81
-
82
-
83
-
84
-
85
-
86
-
87
-
88
-
89
-
90
-
91
-
92
-
93
-
94
-
95
-
96
-
97
-
98
-
99
-
100
-
101
-
102
-
103
-
104
-
105
-
106
-
107
-
108
-
109
-
110
-
111
-
112
-
113
-
114
-
115
-
116
-
117
-
118
-
119
-
120
-
121
-
122
-
123
-
124
 |
 |

61 Express Scripts 2013 Annual Report
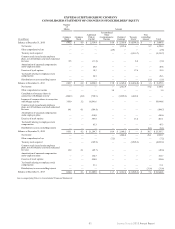
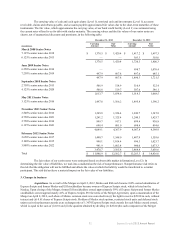
EXPRESS SCRIPTS HOLDING COMPANY
CONSOLIDATED STATEMENT OF CHANGES IN STOCKHOLDERS’ EQUITY
Number
of
Shares Amount
(in millions)
Common
Stock
Common
Stock
Additional
Paid-in
Capital
Accumulated
Other
Comprehensive
Income
Retained
Earnings
Treasury
Stock
Non-
controlling
interest Total
Balance at December 31, 2010 690.2 $ 6.9 $ 2,354.4 $ 19.8 $ 5,369.8 $ (4,144.3) $ — $ 3,606.6
Net income — — — — 1,275.8 — 2.7 1,278.5
Other comprehensive loss — — — (2.8) — — — (2.8)
Treasury stock acquired — — — — — (2,515.7) — (2,515.7)
Common stock issued under employee
plans, net of forfeitures and stock redeemed
for taxes 0.5 — (11.6) — — 8.4 — (3.2)
Amortization of unearned compensation
under employee plans — — 48.8 — — — — 48.8
Exercise of stock options — — 18.3 — — 17.6 — 35.9
Tax benefit relating to employee stock
compensation — — 28.3 — — — — 28.3
Distributions to non-controlling interest — — — — — — (1.1) (1.1)
Balance at December 31, 2011 690.7 $ 6.9 $ 2,438.2 $ 17.0 $ 6,645.6 $ (6,634.0) $ 1.6 $ 2,475.3
Net income — — — — 1,312.9 — 17.2 1,330.1
Other comprehensive income — — — 1.9 — — — 1.9
Cancellation of treasury shares in
connection with Merger activity (204.7) (2.0) (728.5) — (5,890.3) 6,620.8 — —
Issuance of common shares in connection
with Merger activity 318.0 3.2 18,841.6 — — — — 18,844.8
Common stock issued under employee
plans, net of forfeitures and stock redeemed
for taxes 14.1 0.1 (104.8) — — — — (104.7)
Amortization of unearned compensation
under employee plans — — 410.0 — — — — 410.0
Exercise of stock options — — 387.9 — — 13.2 — 401.1
Tax benefit relating to employee stock
compensation — — 45.3 — — — — 45.3
Distributions to non-controlling interest — — — — — — (8.1) (8.1)
Balance at December 31, 2012 818.1 $ 8.2 $ 21,289.7 $ 18.9 $ 2,068.2 $ — $ 10.7 $ 23,395.7
Net income — — — — 1,844.6 — 28.1 1,872.7
Other comprehensive loss — — — (7.2) — — — (7.2)
Treasury stock acquired — — (149.9) — — (3,905.3) — (4,055.2)
Common stock issued under employee
plans, net of forfeitures and stock redeemed
for taxes 15.9 0.1 (49.7) — — — — (49.6)
Amortization of unearned compensation
under employee plans — — 164.7 — — — — 164.7
Exercise of stock options — — 524.0 — — — — 524.0
Tax benefit relating to employee stock
compensation — — 31.1 — — — — 31.1
Distributions to non-controlling interest — — — — — — (31.4) (31.4)
Balance at December 31, 2013 834.0 $ 8.3 $ 21,809.9 $ 11.7 $ 3,912.8 $ (3,905.3) $ 7.4 $ 21,844.8
See accompanying Notes to Consolidated Financial Statements