Express Scripts 2013 Annual Report Download - page 47
Download and view the complete annual report
Please find page 47 of the 2013 Express Scripts annual report below. You can navigate through the pages in the report by either clicking on the pages listed below, or by using the keyword search tool below to find specific information within the annual report.-
 1
1 -
2
-
3
-
4
-
5
-
6
-
7
-
8
-
9
-
10
-
11
-
12
-
13
-
14
-
15
-
16
-
17
-
18
-
19
-
20
-
21
-
22
-
23
-
24
-
25
-
26
-
27
-
28
-
29
-
30
-
31
-
32
-
33
-
34
-
35
-
36
-
 37
37 -
 38
38 -
 39
39 -
 40
40 -
 41
41 -
 42
42 -
 43
43 -
 44
44 -
 45
45 -
 46
46 -
 47
47 -
 48
48 -
 49
49 -
 50
50 -
 51
51 -
 52
52 -
 53
53 -
 54
54 -
 55
55 -
 56
56 -
 57
57 -
58
-
59
-
60
-
61
-
62
-
63
-
64
-
65
-
66
-
67
-
68
-
69
-
70
-
71
-
72
-
73
-
74
-
75
-
76
-
77
-
78
-
79
-
80
-
81
-
82
-
83
-
84
-
85
-
86
-
87
-
88
-
89
-
90
-
91
-
92
-
93
-
94
-
95
-
96
-
97
-
98
-
99
-
100
-
101
-
102
-
103
-
104
-
105
-
106
-
107
-
108
-
109
-
110
-
111
-
112
-
113
-
114
-
115
-
116
-
117
-
118
-
119
-
120
-
121
-
122
-
123
-
124
 |
 |

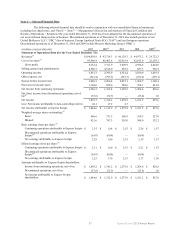
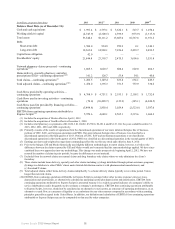
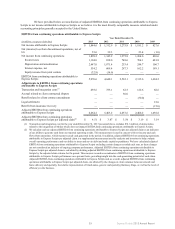
47 Express Scripts 2013 Annual Report
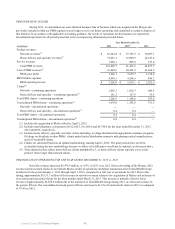
Home delivery and specialty revenues increased $4,760.3 million, or 14.5%, in 2013 over 2012. Due to the timing
of the Merger, 2012 revenues and associated claims do not include Medco results of operations (including transactions from
UnitedHealth Group members) for the period January 1, 2012 through April 1, 2012, compared to a full year of operations for
2013. Due to this timing, approximately $5,216.8 million of the increase in home delivery and specialty revenues relates to the
acquisition of Medco and inclusion of its revenues and associated claims for the three months ended March 31, 2013. In
addition, this increase is due to inflation on branded drugs. These increases are partially offset by lower revenue of
approximately $627.2 million due to the transition of UnitedHealth Group during 2013, as well as an increase in the home
delivery generic fill rate. Our consolidated home delivery generic fill rate increased to 74.6% of home delivery claims in 2013
as compared to 71.5% in 2012. The home delivery generic fill rate is lower than the network generic fill rate as fewer generic
substitutions are available among maintenance medications (e.g., therapies for chronic conditions) commonly dispensed from
home delivery pharmacies compared to acute medications which are primarily dispensed by pharmacies in our retail networks.
Cost of PBM revenues increased $9,537.1 million, or 11.3%, in 2013 when compared to the same period of 2012.
Due to the timing of the Merger, 2012 cost of revenues and associated claims do not include Medco results of operations
(including transactions from UnitedHealth Group members) for the period beginning January 1, 2012 through April 1, 2012,
compared to a full year of operations for 2013. Due to this timing, approximately $13,416.8 million of the increase in cost of
PBM revenues relates to the acquisition of Medco and inclusion of its cost of revenues and associated claims for the three
months ended March 31, 2013. In addition, this increase is due to ingredient cost inflation on branded drugs as well as $238.3
million of transaction and integration costs for 2013 compared to $49.7 million for 2012. These increases are partially offset by
lower cost of revenues of approximately $4,069.4 million due to the transition of UnitedHealth Group during 2013, as well as
an increase in the generic fill rate.
PBM gross profit increased $916.4 million, or 12.9%, in 2013 over 2012. This increase relates to the acquisition of
Medco (including transactions from UnitedHealth Group members) and inclusion of its gross profit and associated claims for
the three months ended March 31, 2013, as discussed above. In addition, this increase is a result of better management of
ingredient costs and cost savings from the increase in the aggregate generic fill rate, partially offset by lower revenues and
associated cost of revenues due to the transition of UnitedHealth Group.
Selling, general and administrative expense (“SG&A”) for the PBM segment increased $229.5 million, or 5.4% in
2013 over 2012. Approximately $832.9 million of this increase relates to the acquisition of Medco, due primarily to the
inclusion of its SG&A and the amortization of intangible assets acquired for the three months ended March 31, 2013, as
discussed above. This increase is partially offset by synergies realized as a result of the Merger, $490.4 million of transaction
and integration costs for 2013 compared to $697.2 million for 2012, and decreased management incentive compensation.
PBM operating income increased $686.9 million, or 24.4%, in 2013 over 2012, based on the various factors
described above.
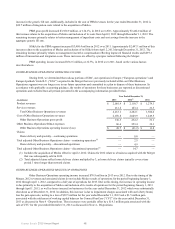
PBM RESULTS OF OPERATIONS FOR THE YEAR ENDED DECEMBER 31, 2012 vs. 2011
Network revenues increased $27,758.2 million, or 92.5%, in 2012 over 2011. Approximately $27,381.0 million of
this increase relates to the acquisition of Medco and inclusion of its revenues and associated claims from April 2, 2012 through
December 31, 2012. The remaining increase represents inflation on branded drugs offset by an increase in the generic fill rate.
Our consolidated network generic fill rate increased to 79.4% of total network claims in 2012 as compared to 75.3% in 2011.
Home delivery and specialty revenues increased $18,313.5 million, or 125.9%, in 2012 over 2011. Approximately
$16,952.3 million of this increase relates to the acquisition of Medco and inclusion of its revenues and associated claims from
April 2, 2012 through December 31, 2012. The remaining increase represents inflation on branded drugs and higher claims
volume attributed to the success of mail conversion programs offset by an increase in the home delivery generic fill rate. Our
consolidated home delivery generic fill rate increased to 71.5% of home delivery claims in 2012 as compared to 63.0% in 2011.
The home delivery generic fill rate is lower than the network generic fill rate as fewer generic substitutions are available among
maintenance medications (e.g., therapies for chronic conditions) commonly dispensed from home delivery pharmacies
compared to acute medications which are primarily dispensed by pharmacies in our retail networks.
Total revenue for the year ended December 31, 2011 also includes charges of $30.0 million related to a client
contractual dispute. In 2012, this dispute was resolved and the impact of the resolution was not material. See Note 12 -
Commitments and contingencies for further discussion of this contractual dispute.
Cost of PBM revenues increased $42,683.6 million, or 102.4%, in 2012 when compared to the same period in
2011. Approximately $41,260.2 million of this increase relates to the acquisition of Medco and inclusion of its costs from April
2, 2012 through December 31, 2012. The increase during the period is also due to ingredient cost inflation partially offset by an