Express Scripts 2013 Annual Report Download - page 95
Download and view the complete annual report
Please find page 95 of the 2013 Express Scripts annual report below. You can navigate through the pages in the report by either clicking on the pages listed below, or by using the keyword search tool below to find specific information within the annual report.-
 1
1 -
2
-
3
-
4
-
5
-
6
-
7
-
8
-
9
-
10
-
11
-
12
-
13
-
14
-
15
-
16
-
17
-
18
-
19
-
20
-
21
-
22
-
23
-
24
-
25
-
26
-
27
-
28
-
29
-
30
-
31
-
32
-
33
-
34
-
35
-
36
-
37
-
38
-
39
-
40
-
41
-
42
-
43
-
44
-
45
-
46
-
47
-
48
-
49
-
50
-
51
-
52
-
53
-
54
-
55
-
56
-
57
-
58
-
59
-
60
-
61
-
62
-
63
-
64
-
65
-
66
-
67
-
68
-
69
-
70
-
71
-
72
-
73
-
74
-
75
-
76
-
77
-
78
-
79
-
80
-
81
-
82
-
83
-
84
-
 85
85 -
 86
86 -
 87
87 -
 88
88 -
 89
89 -
 90
90 -
 91
91 -
 92
92 -
 93
93 -
 94
94 -
 95
95 -
 96
96 -
 97
97 -
 98
98 -
 99
99 -
 100
100 -
 101
101 -
 102
102 -
 103
103 -
 104
104 -
 105
105 -
106
-
107
-
108
-
109
-
110
-
111
-
112
-
113
-
114
-
115
-
116
-
117
-
118
-
119
-
120
-
121
-
122
-
123
-
124
 |
 |

95 Express Scripts 2013 Annual Report
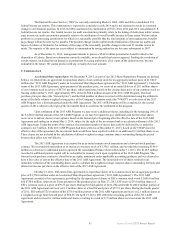
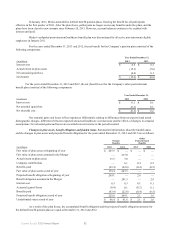
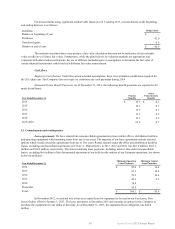
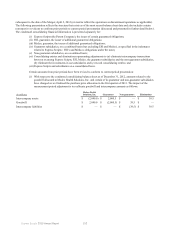
For measurements using significant unobservable inputs (Level 3) during 2013, a reconciliation of the beginning
and ending balances is as follows:
(in millions) Hedge Funds
Balance at beginning of year $—
Purchases 42.0
Unrealized gains 0.9
Balance at end of year $ 42.9
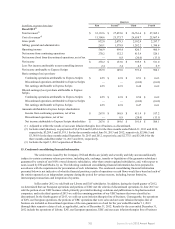
The methods described above may produce a fair value calculation that may not be indicative of net realizable
value or reflective of future fair values. Furthermore, while the plan believes its valuation methods are appropriate and
consistent with other market participants, the use of different methodologies or assumptions to determine the fair value of
certain financial instruments could result in a different fair value measurement.
Cash flows.
Employer Contributions. Under the current actuarial assumptions, there is no minimum contribution required for
the 2013 plan year. The Company does not expect to contribute any cash payments during 2014.
Estimated Future Benefit Payments. As of December 31, 2013, the following benefit payments are expected to be
made (in millions):
Year Ended December 31,
Pension
Benefits
Other
Postretirement
Benefits
2014 $ 15.5 $ 0.3
2015 14.1 0.3
2016 13.7 0.3
2017 13.3 0.2
2018 13.1 0.2
2019-2023 63.8 0.7
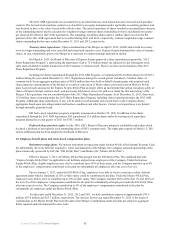
12. Commitments and contingencies
Lease agreements. We have entered into noncancellable agreements to lease certain offices, distribution facilities
and operating equipment with remaining terms from one to ten years. The majority of our lease agreements include renewal
options which would extend the agreements from one to five years. Rental expense under the office and distribution facilities
leases, excluding our discontinued operations (see Note 4 - Dispositions), in 2013, 2012 and 2011 was $83.8 million, $103.6
million and $30.2 million, respectively. The future minimum lease payments, including interest, due under noncancellable
leases, excluding the facilities of the discontinued operations of our held for sale entities of our European operations, are shown
below (in millions):
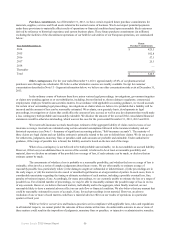
Year Ended December 31,
Minimum Operating
Lease Payments
Minimum Capital
Lease Payments
2014 $ 85.0 $ 14.4
2015 61.1 14.4
2016 53.5 14.4
2017 42.6 0.2
2018 38.4 —
Thereafter 85.5 —
Total $ 366.1 $ 43.4
In November 2012, we entered into a four-year capital lease for equipment to be used in our Fair Lawn, New
Jersey facility effective January 1, 2013. The lease terminates in December 2016 and contains an option for the Company to
purchase the equipment for one dollar at that time. As of December 31, 2013, the capitalized lease obligation was $42.0
million.