Energizer 2014 Annual Report Download - page 97
Download and view the complete annual report
Please find page 97 of the 2014 Energizer annual report below. You can navigate through the pages in the report by either clicking on the pages listed below, or by using the keyword search tool below to find specific information within the annual report.-
 1
1 -
2
-
3
-
4
-
5
-
6
-
7
-
8
-
9
-
10
-
11
-
12
-
13
-
14
-
15
-
16
-
17
-
18
-
19
-
20
-
21
-
22
-
23
-
24
-
25
-
26
-
27
-
28
-
29
-
30
-
31
-
32
-
33
-
34
-
35
-
36
-
37
-
38
-
39
-
40
-
41
-
42
-
43
-
44
-
45
-
46
-
47
-
48
-
49
-
50
-
51
-
52
-
53
-
54
-
55
-
56
-
57
-
58
-
59
-
60
-
61
-
62
-
63
-
64
-
65
-
66
-
67
-
68
-
69
-
70
-
71
-
72
-
73
-
74
-
75
-
76
-
77
-
78
-
79
-
80
-
81
-
82
-
83
-
84
-
85
-
86
-
 87
87 -
 88
88 -
 89
89 -
 90
90 -
 91
91 -
 92
92 -
 93
93 -
 94
94 -
 95
95 -
 96
96 -
 97
97 -
 98
98 -
 99
99 -
 100
100 -
 101
101 -
 102
102 -
 103
103 -
 104
104 -
 105
105 -
 106
106 -
 107
107 -
108
-
109
-
110
-
111
-
112
-
113
-
114
-
115
-
116
 |
 |

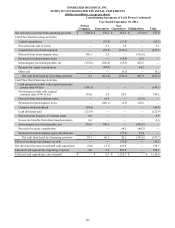
ENERGIZER HOLDINGS, INC.
NOTES TO CONSOLIDATED FINANCIAL STATEMENTS
(Dollars in millions, except per share)
(1) Includes pre-tax costs of $11.8, $5.2 and zero for the twelve months ended September 30, 2014, 2013 and 2012, respectively, associated with certain
information technology enablement activities related to our restructuring project were included in SG&A on the Consolidated Statements of Earnings and
Comprehensive Income. Also, pre-tax costs of $1.0, $6.1 and zero for the twelve months ended September 30, 2014, 2013 and 2012, respectively, associated
with obsolescence charges related to the exit of certain non-core product lines as part of our restructuring are included in Cost of products sold on the
Consolidated Statements of Earnings and Comprehensive Income. The information technology costs and non-core inventory obsolescence charges are
considered part of the total project costs incurred for our restructuring project.
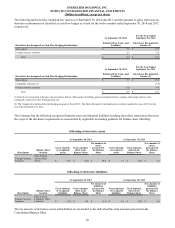
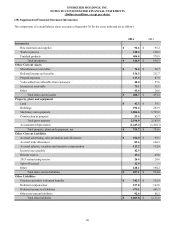
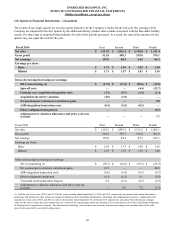
Geographic segment information on a legal entity basis for the years ended September 30:
2014 2013 2012
Net Sales to Customers
United States $ 2,261.8 $ 2,257.5 $ 2,355.0
International 2,185.9 2,208.5 2,212.2
Total net sales $ 4,447.7 $ 4,466.0 $ 4,567.2
Long-Lived Assets
United States $ 461.0 $ 503.5
Canada 84.4 2.2
Germany 62.3 79.4
Singapore 82.0 86.9
Other International 174.7 165.7
Total long-lived assets excluding goodwill and intangibles $ 864.4 $ 837.7
The Company’s international net sales are derived from customers in numerous countries, with sales to customers in Canada
representing 5.3% of the Company's total net sales in fiscal 2014, 5.2% in fiscal 2013 and 5.3% in fiscal 2012, respectively.
Net sales to customers in all other individual foreign countries represented less than 5% of the Company’s total net sales for
each of the three years presented.
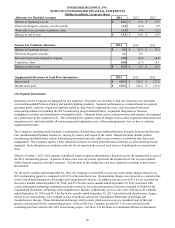
Supplemental product information is presented below for net sales for the years ended September 30:
2014 2013 2012
Net Sales
Wet Shave $ 1,591.5 $ 1,619.0 $ 1,644.2
Alkaline batteries 1,162.7 1,245.9 1,263.4
Other batteries and lighting products 672.8 771.2 824.3
Skin Care 424.5 429.0 430.2
Feminine Care 404.5 177.1 178.3
Infant Care 136.3 169.2 180.3
Other personal care products 55.4 54.6 46.5
Total net sales $ 4,447.7 $ 4,466.0 $ 4,567.2
93