Energizer 2014 Annual Report Download - page 2
Download and view the complete annual report
Please find page 2 of the 2014 Energizer annual report below. You can navigate through the pages in the report by either clicking on the pages listed below, or by using the keyword search tool below to find specific information within the annual report.-
 1
1 -
 2
2 -
 3
3 -
 4
4 -
 5
5 -
 6
6 -
 7
7 -
 8
8 -
 9
9 -
 10
10 -
 11
11 -
 12
12 -
 13
13 -
14
-
15
-
16
-
17
-
18
-
19
-
20
-
21
-
22
-
23
-
24
-
25
-
26
-
27
-
28
-
29
-
30
-
31
-
32
-
33
-
34
-
35
-
36
-
37
-
38
-
39
-
40
-
41
-
42
-
43
-
44
-
45
-
46
-
47
-
48
-
49
-
50
-
51
-
52
-
53
-
54
-
55
-
56
-
57
-
58
-
59
-
60
-
61
-
62
-
63
-
64
-
65
-
66
-
67
-
68
-
69
-
70
-
71
-
72
-
73
-
74
-
75
-
76
-
77
-
78
-
79
-
80
-
81
-
82
-
83
-
84
-
85
-
86
-
87
-
88
-
89
-
90
-
91
-
92
-
93
-
94
-
95
-
96
-
97
-
98
-
99
-
100
-
101
-
102
-
103
-
104
-
105
-
106
-
107
-
108
-
109
-
110
-
111
-
112
-
113
-
114
-
115
-
116
 |
 |
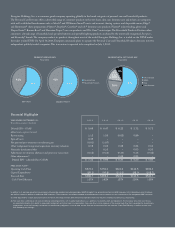
YEAR ENDED SEPTEMBER 30, 2014 2013 2012 2011 2010
($ in millions, except per share data)
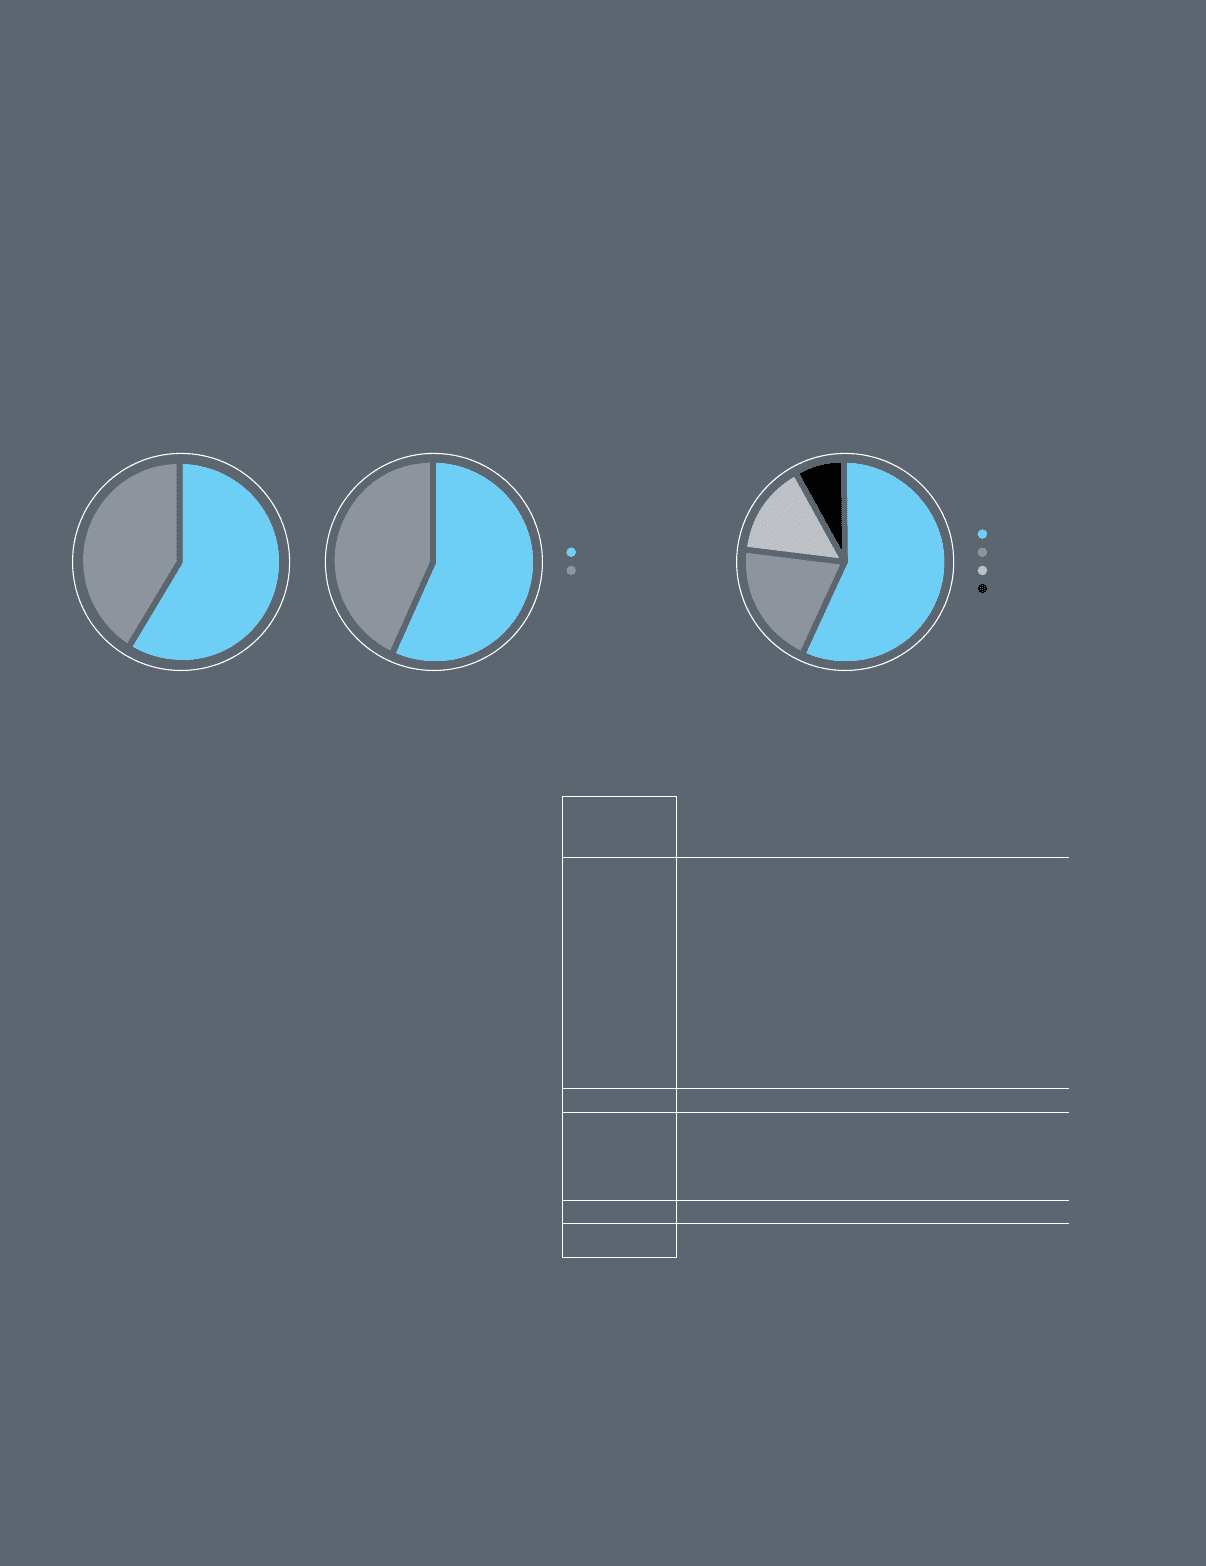
Diluted EPS – GAAP $ 5.69 $ 6.47 $ 6.22 $ 3.72 $ 5.72
Adjustments, expense (income)
Restructuring 1.12 1.55 (0.02) 0.89 –
Spin-o costs 0.45 – – – –
Net pension/post-retirement curtailment gains (0.01) (1.07) – – –
Other realignment/integration/acquisition inventory valuation 0.19 0.04 0.08 0.21 0.10
Venezuela devaluation/other – 0.10 – 0.03 0.20
Adjustments to valuation allowance and prior year tax accruals (0.12) (0.13) (0.10) 0.14 (0.42)
Other adjustments(a) – – 0.02 0.21 –
Diluted EPS – adjusted (Non-GAAP) $ 7.32 $ 6.96 $ 6.20 $ 5.20 $ 5.60
FREE CASH FLOW(b)
Operating Cash Flow $ 572.0 $ 750.0 $ 631.6 $ 412.5 $ 652.4
Capital Expenditures (85.3) (90.6) (111.0) (98.0) (108.7)
Free cash ow $ 486.7 $ 659.4 $ 520.6 $ 314.5 $ 543.7
Cash Flow Eciency 137% 162% 127% 120% 135%
Energizer Holdings, Inc. is a consumer goods company operating globally in the broad categories of personal care and household products.
e Personal Care Division oers a diversied range of consumer products in the wet shave, skin care, feminine care and infant care categories
with well-established brand names such as Schick® and Wilkinson Sword® men’s and women’s shaving systems and disposable razors; Edge®
and Skintimate® shave preparations; Playtex®, Stayfree®, Carefree® and o.b.® feminine care products; Playtex® infant feeding, gloves and
Diaper Genie®; Banana Boat® and Hawaiian Tropic® sun care products; and Wet Ones® moist wipes. e Household Products Division oers
consumers a broad range of household and specialty batteries and portable lighting products, anchored by the universally recognized Energizer®
and Eveready® brands. e company markets its products throughout most of the world. Energizer Holdings, Inc. is traded on the NYSE under
the ticker symbol ENR. On April 30, 2014, Energizer announced plans to separate the Personal Care and Household Products divisions into two
independent, publicly traded companies. is transaction is expected to be completed on July 1, 2015.
Financial Highlights
In addition to its earnings presented in accordance with generally accepted accounting principles (GAAP) Energizer® has presented certain non-GAAP measures in the table above, which it believes
are useful to readers in addition to traditional GAAP measures. These measures should be considered as an alternative to, but not superior to or as a substitute for, the comparable GAAP measures.
(a) Other adjustments include: Early termination of interest rate swap and early debt retirement/duplicate interest for the years ended 2012 and 2011, respectively.
(b) Free cash ow is dened as net cash provided by operating activities net of capital expenditures, i.e., additions to property, plant and equipment. The Company views free cash ow as
an important indicator of its ability to repay debt, fund growth and return cash to shareholders. Free cash ow is not a measure of the residual cash ow that is available for discretionary
expenditures, since the Company has certain non-discretionary obligations, such as debt service, that are not deducted from the measure. Cash Flow Efciency is dened as free cash
ow divided by net earnings.
SEGMENT BREAKDOWN
Fiscal 2014
NET SALES
59%
41%
SEGMENT PROFIT
57%
43% •Personal Care
•Household Products
GEOGRAPHICAL NET SALES MIX
Fiscal 2014
8%
57%
20%
15% •US & Canada
•EMEA
•Asia
•Latin America