Energizer 2014 Annual Report Download - page 39
Download and view the complete annual report
Please find page 39 of the 2014 Energizer annual report below. You can navigate through the pages in the report by either clicking on the pages listed below, or by using the keyword search tool below to find specific information within the annual report.-
 1
1 -
2
-
3
-
4
-
5
-
6
-
7
-
8
-
9
-
10
-
11
-
12
-
13
-
14
-
15
-
16
-
17
-
18
-
19
-
20
-
21
-
22
-
23
-
24
-
25
-
26
-
27
-
28
-
 29
29 -
 30
30 -
 31
31 -
 32
32 -
 33
33 -
 34
34 -
 35
35 -
 36
36 -
 37
37 -
 38
38 -
 39
39 -
 40
40 -
 41
41 -
 42
42 -
 43
43 -
 44
44 -
 45
45 -
 46
46 -
 47
47 -
 48
48 -
 49
49 -
50
-
51
-
52
-
53
-
54
-
55
-
56
-
57
-
58
-
59
-
60
-
61
-
62
-
63
-
64
-
65
-
66
-
67
-
68
-
69
-
70
-
71
-
72
-
73
-
74
-
75
-
76
-
77
-
78
-
79
-
80
-
81
-
82
-
83
-
84
-
85
-
86
-
87
-
88
-
89
-
90
-
91
-
92
-
93
-
94
-
95
-
96
-
97
-
98
-
99
-
100
-
101
-
102
-
103
-
104
-
105
-
106
-
107
-
108
-
109
-
110
-
111
-
112
-
113
-
114
-
115
-
116
 |
 |

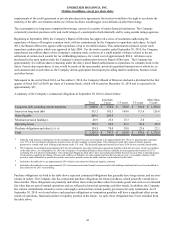
ENERGIZER HOLDINGS, INC.
(Dollars in millions, except per share data)
For The Years Ended September 30,
Net Earnings Diluted EPS
2014 2013 2012 2014 2013 2012
Net Earnings/Diluted EPS - GAAP $ 356.1 $ 407.0 $ 408.9 $ 5.69 $ 6.47 $ 6.22
Impacts, net of tax: expense (income)
2013 restructuring and related costs (1) 70.5 97.9 4.6 1.12 1.55 0.07
One time spin-off costs 28.1 ——
0.45 ——
Feminine care acquisition/integration costs 6.2 ——
0.10 ——
Acquisition inventory valuation 5.0 ——
0.08 ——
Net pension / post retirement benefit gains (0.8)(67.5)—
(0.01)(1.07)—
2011 Household Products restructuring ——(5.7)——(0.09)
Other realignment/integration 0.9 2.6 5.6 0.01 0.04 0.08
Venezuela devaluation/other impacts —6.3 — —0.10 —
Early termination of interest rate swap —— 1.1 —— 0.02
Adjustment to prior years' tax accruals (7.7)(8.3)(7.0)(0.12)(0.13)(0.10)
Net Earnings/Diluted EPS - adjusted (Non-GAAP) $ 458.3 $ 438.0 $ 407.5 $ 7.32 $ 6.96 $ 6.20
Weighted average shares - diluted 62.6 62.9 65.7
(1) Includes net of tax costs of $7.6, $3.4 and zero for the twelve months ended September 30, 2014, 2013 and 2012, respectively, associated with certain
information technology and related activities, which are included in SG&A on the Consolidated Statements of Earnings and Comprehensive Income.
Additionally, this includes net of tax costs of $0.8, $3.8 and zero, for the twelve months ended September 30, 2014, 2013 and 2012, respectively, associated
with obsolescence charges related to the exit of certain non-core product lines as a result of our restructuring, which are included in Cost of products sold on the
Consolidated Statements of Earnings and Comprehensive Income.
Operating Results
Net Sales
Net Sales - Total Company
For the Years Ended September 30,
2014 % Chg 2013 % Chg 2012
Net sales - prior year $ 4,466.0 $ 4,567.2 $ 4,645.7
Organic (182.1) (4.1)% (50.5) (1.1)% (55.6)
Impact of currency (66.3) (1.5)% (50.7) (1.1)% (69.1)
Incremental impact of acquisitions 230.1 5.2 % — — % 46.2
Net sales - current year $ 4,447.7 (0.4)% $ 4,466.0 (2.2)% $ 4,567.2
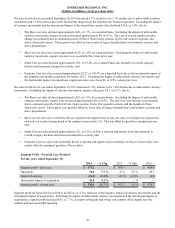
Net sales for fiscal 2014 were $4,447.7, down $18.3 or 0.4%, as compared to fiscal 2013, including the unfavorable impact of
currency movements of approximately $66 and the incremental benefit of $230 related to the feminine care brands acquisition.
Excluding the unfavorable impact of currency movements and incremental sales from the impact of the acquisition, organic
sales decreased 4.1% as organic sales declined in both segments. Organic net sales in Personal Care declined 1.4% due to
continued category softness and increased competition. Organic net sales in Household Products declined by 7.3% in fiscal
2014 driven primarily by continued battery category declines and the negative impact of certain customer losses in the U.S. in
the fiscal fourth quarter of 2013.
Net sales for fiscal 2013 were $4,466.0, down $101.2 or 2.2%, as compared to fiscal 2012, including the unfavorable impact of
currency movements of approximately $51. Excluding the unfavorable impact of currency movements, organic sales decreased
1.1%, as organic sales in Personal Care were essentially flat while organic sales in Household Products declined by 2.6% in
fiscal 2013 driven primarily by continued battery category declines and the negative impact of certain customer losses in the
U.S. in the fourth fiscal quarter of 2013.
35