Energizer 2014 Annual Report Download - page 36
Download and view the complete annual report
Please find page 36 of the 2014 Energizer annual report below. You can navigate through the pages in the report by either clicking on the pages listed below, or by using the keyword search tool below to find specific information within the annual report.-
 1
1 -
2
-
3
-
4
-
5
-
6
-
7
-
8
-
9
-
10
-
11
-
12
-
13
-
14
-
15
-
16
-
17
-
18
-
19
-
20
-
21
-
22
-
23
-
24
-
25
-
 26
26 -
 27
27 -
 28
28 -
 29
29 -
 30
30 -
 31
31 -
 32
32 -
 33
33 -
 34
34 -
 35
35 -
 36
36 -
 37
37 -
 38
38 -
 39
39 -
 40
40 -
 41
41 -
 42
42 -
 43
43 -
 44
44 -
 45
45 -
 46
46 -
47
-
48
-
49
-
50
-
51
-
52
-
53
-
54
-
55
-
56
-
57
-
58
-
59
-
60
-
61
-
62
-
63
-
64
-
65
-
66
-
67
-
68
-
69
-
70
-
71
-
72
-
73
-
74
-
75
-
76
-
77
-
78
-
79
-
80
-
81
-
82
-
83
-
84
-
85
-
86
-
87
-
88
-
89
-
90
-
91
-
92
-
93
-
94
-
95
-
96
-
97
-
98
-
99
-
100
-
101
-
102
-
103
-
104
-
105
-
106
-
107
-
108
-
109
-
110
-
111
-
112
-
113
-
114
-
115
-
116
 |
 |

ENERGIZER HOLDINGS, INC.
(Dollars in millions, except per share data)
• Net earnings per diluted share of $5.69, down 12.1%; adjusted net earnings per diluted share of $7.32, up 5.2% (as
shown in the below reconciliation);
• Net sales down 0.4% (down 4.1% organically, as shown in the below reconciliation) due primarily to previously
disclosed loss of distribution in two U.S. retail customers in Household Products (down 7.3% organically) and
continued category softness and extensive competitive activity in Personal Care (down 1.4% organically);
• Gross margin up 90 basis points as a percent of net sales on a reported basis driven by improvements realized from our
2013 restructuring project;
• Selling, general and administrative expense (SG&A) as a percent of net sales increased 80 basis points versus prior
year on a reported basis. SG&A as a percent of net sales decreased 50 basis points versus prior year exclusive of one-
time unusual items (such as acquisition, integration, spin-off and restructuring related costs);
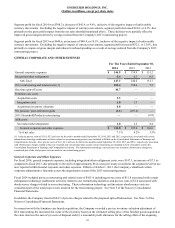
• Average managed working capital (as defined) as a percent of net sales declined to 15.0% for fiscal 2014 as compared
to 18.1% in fiscal 2013 and as compared to the fiscal 2011 baseline established at the beginning of the initiative of
22.9%. See "Liquidity and Capital Resources - Operating Activities" for definition of managed working capital;
• Net cash flow from operating activities was $572.0, down $178.0 or 24% as compared to fiscal 2013 due to reduced
full year net earnings and higher September 2014 sales and the subsequent timing of collection of accounts receivable
balances; and
• Cash payments of dividends to common shareholders were $123.9.
2014 Developments
Acquisition of Feminine Care Brands
In October 2013, which is the first fiscal quarter of 2014, the Company acquired the Stayfree pad, Carefree liner and o.b.
tampon feminine care brands in the U.S., Canada and the Caribbean from Johnson & Johnson for an aggregate cash purchase
price of $187.1, inclusive of a $1.8 working capital adjustment. The acquisition was financed with approximately $135 of
available foreign cash for the estimated value of assets acquired in Canada including the Johnson & Johnson, Inc.
manufacturing plant in Montreal, Canada, and approximately $50 of U.S. cash, primarily from borrowings under the
Company's available debt facilities for the estimated value of assets acquired in the U.S. Liabilities assumed as a result of the
acquisition are limited, primarily to certain employee benefit obligations.
Restructuring Project
In November 2012, the Company’s Board of Directors authorized an enterprise-wide restructuring plan and delegated authority
to the Company’s management to determine the final actions with respect to this plan (2013 Restructuring project).
In January 2014, the Company's Board of Directors authorized an expansion of scope of the previously announced 2013
restructuring project. As a result of the expanded scope of the Company's restructuring efforts, the project is expected to
generate additional savings and the Company expects to incur additional charges in order to execute the planned initiatives.
The Company expects to achieve $300 of savings prior to the anticipated closing of the planned spin-off transaction on July 1,
2015. Estimated total project savings have been increased to $330 through fiscal 2016. In addition, the Company estimates
total pre-tax restructuring related costs (including the original and expanded scope) needed to execute this project will be
approximately $350.
For the twelve months ended September 30, 2014, the Company estimates that gross restructuring savings total approximately
$255.
For the twelve months ended September 30, 2014, the Company recorded $92.6 in pre-tax restructuring charges related to its
2013 restructuring project as compared to $139.3 in the prior fiscal year. Restructuring charges were reported on a separate line
in the Consolidated Statements of Earnings and Comprehensive Income. In addition, pre-tax costs of $11.8 were recorded for
the twelve months ended September 30, 2014 and $5.2 for the twelve months ended September 30, 2013 associated with certain
information technology enablement activities related to our restructuring project and were included in SG&A on the
Consolidated Statements of Earnings and Comprehensive Income. Additionally, pre-tax costs of $1.0 for the twelve months
ended September 30, 2014, and $6.1 for the twelve months ended September 30, 2013 associated with obsolescence charges
related to our restructuring, were included in Cost of products sold on the Consolidated Statements of Earnings and
Comprehensive Income. These information technology and inventory obsolescence costs are considered part of the total
project costs incurred for the restructuring project.
32