Energizer 2014 Annual Report Download - page 44
Download and view the complete annual report
Please find page 44 of the 2014 Energizer annual report below. You can navigate through the pages in the report by either clicking on the pages listed below, or by using the keyword search tool below to find specific information within the annual report.-
 1
1 -
2
-
3
-
4
-
5
-
6
-
7
-
8
-
9
-
10
-
11
-
12
-
13
-
14
-
15
-
16
-
17
-
18
-
19
-
20
-
21
-
22
-
23
-
24
-
25
-
26
-
27
-
28
-
29
-
30
-
31
-
32
-
33
-
 34
34 -
 35
35 -
 36
36 -
 37
37 -
 38
38 -
 39
39 -
 40
40 -
 41
41 -
 42
42 -
 43
43 -
 44
44 -
 45
45 -
 46
46 -
 47
47 -
 48
48 -
 49
49 -
 50
50 -
 51
51 -
 52
52 -
 53
53 -
 54
54 -
55
-
56
-
57
-
58
-
59
-
60
-
61
-
62
-
63
-
64
-
65
-
66
-
67
-
68
-
69
-
70
-
71
-
72
-
73
-
74
-
75
-
76
-
77
-
78
-
79
-
80
-
81
-
82
-
83
-
84
-
85
-
86
-
87
-
88
-
89
-
90
-
91
-
92
-
93
-
94
-
95
-
96
-
97
-
98
-
99
-
100
-
101
-
102
-
103
-
104
-
105
-
106
-
107
-
108
-
109
-
110
-
111
-
112
-
113
-
114
-
115
-
116
 |
 |

ENERGIZER HOLDINGS, INC.
(Dollars in millions, except per share data)
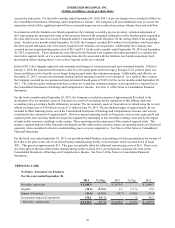
Segment profit for fiscal 2013 was $475.2, up $4.5, or 1.0%, inclusive of the negative impact of currency movements.
Excluding the impact of unfavorable currency movements, segment profit increased 5.9% as lower spending more than offset
lower gross profit due to a modestly lower gross margin on sales.
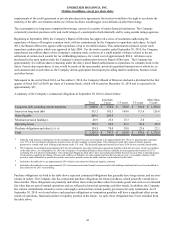
HOUSEHOLD PRODUCTS
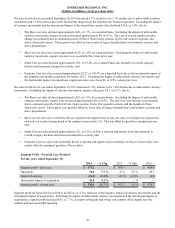
Net Sales - Household Products
For the years ended September 30,
2014 % Chg 2013 % Chg 2012
Net sales - prior year $ 2,017.1 $ 2,087.7 $ 2,196.0
Organic (146.7) (7.3)% (54.6) (2.6)% (70.6)
Impact of currency (34.9) (1.7)% (16.0) (0.8)% (37.7)
Net sales - current year $ 1,835.5 (9.0)% $ 2,017.1 (3.4)% $ 2,087.7
Net sales for the twelve months ended September 30, 2014 decreased 9.0%, inclusive of a 1.7% decline due to unfavorable
currency movements. Excluding the impact of currency movements, organic sales declined 7.3% due primarily to the loss of
distribution within two U.S. retail customers (which occurred in the fourth fiscal quarter of fiscal 2013), continued household
battery category declines and hurricane response storm volumes that occurred in fiscal 2013 but did not repeat in fiscal 2014.
Net sales for the twelve months ended September 30, 2013 decreased 3.4%, inclusive of a 0.8% decline due to unfavorable
currency movements. Excluding the impact of currency movements, organic sales declined 2.6% due primarily to the loss of
distribution within two U.S. retail customers (which occurred in the fourth fiscal quarter of fiscal 2013), continued household
battery category declines and the exiting of certain non-core product lines earlier in fiscal 2013 (as part of the Company's 2013
restructuring project).
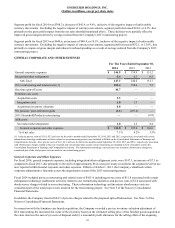
Segment Profit - Household Products
For the years ended September 30,
2014 % Chg 2013 % Chg 2012
Segment profit - prior year $ 440.6 $ 400.2 $ 410.6
Operations (18.0) (4.1)% 52.1 13.0 % 12.1
Impact of currency (24.4) (5.5)% (11.7) (2.9)% (22.5)
Segment profit - current year $ 398.2 (9.6)% $ 440.6 10.1 % $ 400.2
40