Energizer 2014 Annual Report Download - page 40
Download and view the complete annual report
Please find page 40 of the 2014 Energizer annual report below. You can navigate through the pages in the report by either clicking on the pages listed below, or by using the keyword search tool below to find specific information within the annual report.-
 1
1 -
2
-
3
-
4
-
5
-
6
-
7
-
8
-
9
-
10
-
11
-
12
-
13
-
14
-
15
-
16
-
17
-
18
-
19
-
20
-
21
-
22
-
23
-
24
-
25
-
26
-
27
-
28
-
29
-
 30
30 -
 31
31 -
 32
32 -
 33
33 -
 34
34 -
 35
35 -
 36
36 -
 37
37 -
 38
38 -
 39
39 -
 40
40 -
 41
41 -
 42
42 -
 43
43 -
 44
44 -
 45
45 -
 46
46 -
 47
47 -
 48
48 -
 49
49 -
 50
50 -
51
-
52
-
53
-
54
-
55
-
56
-
57
-
58
-
59
-
60
-
61
-
62
-
63
-
64
-
65
-
66
-
67
-
68
-
69
-
70
-
71
-
72
-
73
-
74
-
75
-
76
-
77
-
78
-
79
-
80
-
81
-
82
-
83
-
84
-
85
-
86
-
87
-
88
-
89
-
90
-
91
-
92
-
93
-
94
-
95
-
96
-
97
-
98
-
99
-
100
-
101
-
102
-
103
-
104
-
105
-
106
-
107
-
108
-
109
-
110
-
111
-
112
-
113
-
114
-
115
-
116
 |
 |

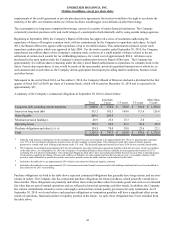
ENERGIZER HOLDINGS, INC.
(Dollars in millions, except per share data)
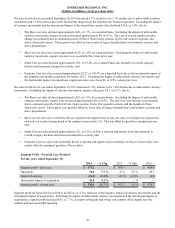
For further discussion regarding net sales in Personal Care and Household Products, including a summary of reported versus
organic changes, please see the section titled “Segment Results” provided below.
Gross Profit
Gross profit dollars were $2,135.2 in fiscal 2014, $2,104.3 in fiscal 2013 and $2,137.9 in fiscal 2012. The increase in gross
profit in fiscal 2014 as compared to fiscal 2013 was due primarily to the favorable impact of savings realized from the 2013
restructuring project and the incremental benefit realized from the feminine care brands acquisition. These items were able to
offset organic top-line shortfalls in both segments and the impact of unfavorable foreign currency movements.
Gross Margin as a percent of net sales for fiscal 2014 was 48.0%, up 90 basis points as compared to fiscal 2013. The increase
was driven by the favorable impact of our 2013 restructuring project and improved pricing in the Personal Care segment.
Gross Margin as a percent of net sales for fiscal 2013 was 47.1%, up approximately 30 basis points as compared to fiscal 2012.
However, excluding the unfavorable impact of currency movements, gross margin as a percent of net sales for fiscal 2013
increased 80 basis points versus fiscal 2012. This increase was driven by the favorable impact of our 2013 restructuring project
and lower product input costs, most notably in Household Products.
Selling, General and Administrative
SG&A expenses were $859.9 in fiscal 2014, or 19.3% of net sales as compared to $825.0, or 18.5% of net sales for fiscal 2013
and $887.8, or 19.4% of net sales for fiscal 2012. Included in SG&A in fiscal 2014 was approximately $44.7 of pre-tax spin-off
related charges. The Company incurred, and will continue to incur, incremental costs to evaluate, plan and execute the
transaction. In addition, there were $9.9 of pre-tax acquisition and integration costs and $11.8 of pre-tax information
technology enablement costs directly associated with our restructuring initiatives recorded within SG&A during fiscal 2014.
Similarly, fiscal years 2013 and 2012 included approximately $4 and $6, respectively, of pre-tax acquisition and integration
costs and approximately $5 and $7, respectively of pre-tax information technology enablement costs directly associated with
our restructuring initiatives were recorded within SG&A.
Advertising and Sales Promotion
For fiscal 2014, advertising and sales promotion (A&P) was $492.9, up $53 as compared to fiscal 2013. A&P as a percent of
net sales was 11.1% for fiscal 2014 and was 9.8% in fiscal years 2013 and 2012. The higher level of A&P spending in absolute
dollars and as a percentage of net sales in fiscal 2014 as compared to the prior year was due to incremental spending associated
with the feminine care brands acquisition and increased overall strategic brand support initiative spending. A&P expense may
vary from year to year with new product launches, the impact of acquisitions, strategic brand support initiatives, the overall
competitive environment, and the state of the global economy.
Research and Development
Research and development (R&D) expense was $94.8 in fiscal 2014, $99.0 in fiscal 2013 and $112.5 in fiscal 2012. The
decrease in fiscal 2014 was due primarily to lower costs in Household Products as a result of our 2013 restructuring project. As
a percent of sales, R&D expense was approximately 2.1% in fiscal 2014, 2.2% in fiscal 2013 and 2.5% in fiscal 2012.
Interest and Other Financing Items, Net
Interest expense for fiscal 2014 was $122.6, a decrease of $7.9 as compared to fiscal 2013 due to lower average debt
outstanding. Interest expense for fiscal 2013 was $130.5, an increase of $3.2 as compared to fiscal 2012 due primarily to a
slightly higher average borrowing rate.
Other financing, net was zero in fiscal 2014 reflecting the net impact of hedging contract gains and interest income offset by
revaluation losses on nonfunctional currency balance sheet exposures. In fiscal 2013, Other financing, net was an expense of
$10.3, including approximately $6 related to the Venezuela currency devaluation. The remaining expense was due primarily to
a loss of approximately $3 related to the wind-down of certain commodity derivative contracts.
Income Taxes
Income taxes, which include federal, state and foreign taxes, were 24.8%, 28.3% and 27.7% of earnings before income taxes in
fiscal 2014, 2013 and 2012, respectively.
For fiscal 2014, the effective tax rate was 24.8%, which was favorably impacted by costs related to the proposed spin-off
transaction and the 2013 restructuring project. Both of these charges were primarily incurred in the U.S., which has resulted in
a higher tax benefit as compared to our overall global effective tax rate. This year's rate was favorably impacted by prior year
tax adjustments recorded in the fourth fiscal quarter of approximately $8 million. In addition, the fiscal 2014 effective tax rate
36