Energizer 2014 Annual Report Download - page 96
Download and view the complete annual report
Please find page 96 of the 2014 Energizer annual report below. You can navigate through the pages in the report by either clicking on the pages listed below, or by using the keyword search tool below to find specific information within the annual report.-
 1
1 -
2
-
3
-
4
-
5
-
6
-
7
-
8
-
9
-
10
-
11
-
12
-
13
-
14
-
15
-
16
-
17
-
18
-
19
-
20
-
21
-
22
-
23
-
24
-
25
-
26
-
27
-
28
-
29
-
30
-
31
-
32
-
33
-
34
-
35
-
36
-
37
-
38
-
39
-
40
-
41
-
42
-
43
-
44
-
45
-
46
-
47
-
48
-
49
-
50
-
51
-
52
-
53
-
54
-
55
-
56
-
57
-
58
-
59
-
60
-
61
-
62
-
63
-
64
-
65
-
66
-
67
-
68
-
69
-
70
-
71
-
72
-
73
-
74
-
75
-
76
-
77
-
78
-
79
-
80
-
81
-
82
-
83
-
84
-
85
-
 86
86 -
 87
87 -
 88
88 -
 89
89 -
 90
90 -
 91
91 -
 92
92 -
 93
93 -
 94
94 -
 95
95 -
 96
96 -
 97
97 -
 98
98 -
 99
99 -
 100
100 -
 101
101 -
 102
102 -
 103
103 -
 104
104 -
 105
105 -
 106
106 -
107
-
108
-
109
-
110
-
111
-
112
-
113
-
114
-
115
-
116
 |
 |
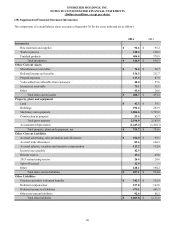
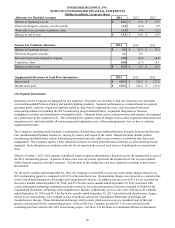
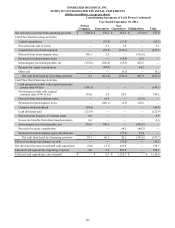
ENERGIZER HOLDINGS, INC.
NOTES TO CONSOLIDATED FINANCIAL STATEMENTS
(Dollars in millions, except per share)
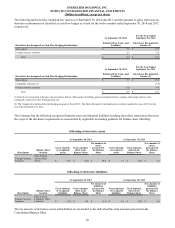
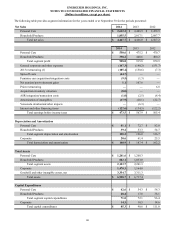
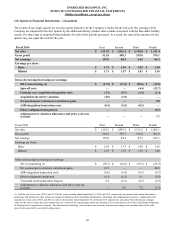
The following table provides segment information for the years ended or at September 30 for the periods presented:
Net Sales 2014 2013 2012
Personal Care $ 2,612.2 $ 2,448.9 $ 2,479.5
Household Products 1,835.5 2,017.1 2,087.7
Total net sales $ 4,447.7 $ 4,466.0 $ 4,567.2
2014 2013 2012
Personal Care $ 530.6 $ 475.2 $ 470.7
Household Products 398.2 440.6 400.2
Total segment profit 928.8 915.8 870.9
General corporate and other expenses (147.3)(140.2)(151.7)
2013 restructuring (1) (105.4)(150.6)(7.3)
Spin-off costs (44.7)——
Feminine care acquisition/integration costs (9.5)(1.3)—
Net pension/post-retirement gains 1.1 107.6 —
Prior restructuring —— 6.8
Acquisition inventory valuation (8.0)——
ASR integration/transaction costs (1.0)(2.5)(8.4)
Amortization of intangibles (17.9)(20.1)(22.7)
Venezuela devaluation/other impacts —(6.3)—
Interest and other financing items (122.6)(134.5)(122.2)
Total earnings before income taxes $ 473.5 $ 567.9 $ 565.4
Depreciation and Amortization
Personal Care $ 81.1 $ 72.7 $ 82.0
Household Products 39.2 53.3 54.7
Total segment depreciation and amortization 120.3 126.0 136.7
Corporate 20.6 61.4 25.5
Total depreciation and amortization $ 140.9 $ 187.4 $ 162.2
Total Assets
Personal Care $ 1,241.6 $ 1,208.3
Household Products 882.1 1,033.0
Total segment assets 2,123.7 2,241.3
Corporate 1,470.3 1,164.8
Goodwill and other intangible assets, net 3,334.7 3,311.3
Total assets $ 6,928.7 $ 6,717.4
Capital Expenditures
Personal Care $ 42.6 $ 54.3 $ 58.3
Household Products 28.4 17.8 38.1
Total segment capital expenditures 71.0 72.1 96.4
Corporate 14.3 18.5 14.6
Total capital expenditures $ 85.3 $ 90.6 $ 111.0
92