Energizer 2014 Annual Report Download - page 63
Download and view the complete annual report
Please find page 63 of the 2014 Energizer annual report below. You can navigate through the pages in the report by either clicking on the pages listed below, or by using the keyword search tool below to find specific information within the annual report.-
 1
1 -
2
-
3
-
4
-
5
-
6
-
7
-
8
-
9
-
10
-
11
-
12
-
13
-
14
-
15
-
16
-
17
-
18
-
19
-
20
-
21
-
22
-
23
-
24
-
25
-
26
-
27
-
28
-
29
-
30
-
31
-
32
-
33
-
34
-
35
-
36
-
37
-
38
-
39
-
40
-
41
-
42
-
43
-
44
-
45
-
46
-
47
-
48
-
49
-
50
-
51
-
52
-
 53
53 -
 54
54 -
 55
55 -
 56
56 -
 57
57 -
 58
58 -
 59
59 -
 60
60 -
 61
61 -
 62
62 -
 63
63 -
 64
64 -
 65
65 -
 66
66 -
 67
67 -
 68
68 -
 69
69 -
 70
70 -
 71
71 -
 72
72 -
 73
73 -
74
-
75
-
76
-
77
-
78
-
79
-
80
-
81
-
82
-
83
-
84
-
85
-
86
-
87
-
88
-
89
-
90
-
91
-
92
-
93
-
94
-
95
-
96
-
97
-
98
-
99
-
100
-
101
-
102
-
103
-
104
-
105
-
106
-
107
-
108
-
109
-
110
-
111
-
112
-
113
-
114
-
115
-
116
 |
 |

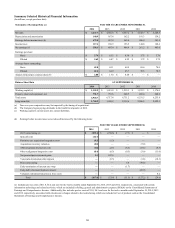
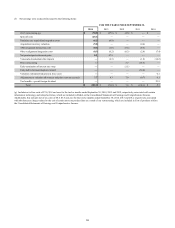
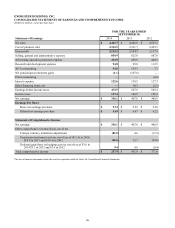
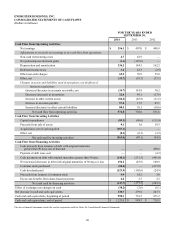
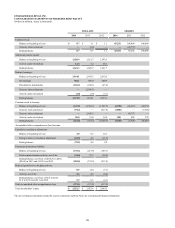
ENERGIZER HOLDINGS, INC.
CONSOLIDATED STATEMENTS OF SHAREHOLDERS' EQUITY
(Dollars in millions, shares in thousands)
DOLLARS SHARES
2014 2013 2012 2014 2013 2012
Common stock:
Balance at beginning of year $ 0.7 $ 1.1 $ 1.1 65,252 108,009 108,009
Treasury share retirement —(0.4) — —(42,757) —
Ending balance 0.7 0.7 1.1 65,252 65,252 108,009
Additional paid-in capital:
Balance at beginning of year 1,628.9 1,621.7 1,593.6
Activity under stock plans 12.4 7.2 28.1
Ending balance 1,641.3 1,628.9 1,621.7
Retained earnings:
Balance at beginning of year 1,144.1 2,993.2 2,613.0
Net earnings 356.1 407.0 408.9
Dividends to shareholders (126.2) (108.1) (25.6)
Treasury share retirement —(2,146.1) —
Activity under stock plans (1.0) (1.9) (3.1)
Ending balance 1,373.0 1,144.1 2,993.2
Common stock in treasury:
Balance at beginning of year (147.2) (2,328.7) (1,925.7) (2,928) (46,487) (40,933)
Treasury stock purchased (94.4) — (417.8) (1,000) — (5,924)
Treasury share retirement —2,146.5 — —42,757 —
Activity under stock plans 20.0 35.0 14.8 500 802 370
Ending balance (221.6) (147.2) (2,328.7) (3,428) (2,928) (46,487)
Accumulated other comprehensive (loss)/income:
Cumulative translation adjustment:
Balance at beginning of year 4.8 0.2 12.1
Foreign currency translation adjustment (83.0) 4.6 (11.9)
Ending balance (78.2) 4.8 0.2
Pension/postretirement liability:
Balance at beginning of year (178.2) (213.9) (189.1)
Pension/postretirement activity, net of tax (24.6) 35.7 (24.8)
Ending balance, net of tax of ($106.5) in 2014,
($94.9) in 2013 and ($113.8) in 2012 (202.8) (178.2) (213.9)
Deferred gain/(loss) on hedging activity:
Balance at beginning of year 0.5 (4.1) (3.7)
Activity, net of tax 9.4 4.6 (0.4)
Ending balance, net of tax of $4.6 in 2014,
$1.0 in 2013 and ($2.1) in 2012 9.9 0.5 (4.1)
Total accumulated other comprehensive loss (271.1) (172.9) (217.8)
Total shareholders' equity $ 2,522.3 $ 2,453.6 $ 2,069.5
The above financial statements should be read in conjunction with the Notes To Consolidated Financial Statements.
59