Energizer 2014 Annual Report Download - page 45
Download and view the complete annual report
Please find page 45 of the 2014 Energizer annual report below. You can navigate through the pages in the report by either clicking on the pages listed below, or by using the keyword search tool below to find specific information within the annual report.-
 1
1 -
2
-
3
-
4
-
5
-
6
-
7
-
8
-
9
-
10
-
11
-
12
-
13
-
14
-
15
-
16
-
17
-
18
-
19
-
20
-
21
-
22
-
23
-
24
-
25
-
26
-
27
-
28
-
29
-
30
-
31
-
32
-
33
-
34
-
 35
35 -
 36
36 -
 37
37 -
 38
38 -
 39
39 -
 40
40 -
 41
41 -
 42
42 -
 43
43 -
 44
44 -
 45
45 -
 46
46 -
 47
47 -
 48
48 -
 49
49 -
 50
50 -
 51
51 -
 52
52 -
 53
53 -
 54
54 -
 55
55 -
56
-
57
-
58
-
59
-
60
-
61
-
62
-
63
-
64
-
65
-
66
-
67
-
68
-
69
-
70
-
71
-
72
-
73
-
74
-
75
-
76
-
77
-
78
-
79
-
80
-
81
-
82
-
83
-
84
-
85
-
86
-
87
-
88
-
89
-
90
-
91
-
92
-
93
-
94
-
95
-
96
-
97
-
98
-
99
-
100
-
101
-
102
-
103
-
104
-
105
-
106
-
107
-
108
-
109
-
110
-
111
-
112
-
113
-
114
-
115
-
116
 |
 |

ENERGIZER HOLDINGS, INC.
(Dollars in millions, except per share data)
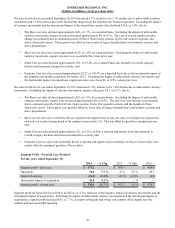
Segment profit for fiscal 2014 was $398.2 a decrease of $42.4, or 9.6%, inclusive of the negative impact of unfavorable
currency movements. Excluding the negative impact of currency movements, segment profit decreased $18.0, or 4.1%, due
primarily to the gross profit impact from the net sales shortfall mentioned above. These declines were partially offset by
improved gross margins driven by savings realized from the Company's 2013 restructuring project.
Segment profit for fiscal 2013 was $440.6, an increase of $40.4, or 10.1%, inclusive of the negative impact of unfavorable
currency movements. Excluding the negative impact of currency movements, segment profit increased $52.1, or 13.0%, due
primarily to improved gross margin and reduced overhead spending as a result of savings realized from the Company's 2013
restructuring project.
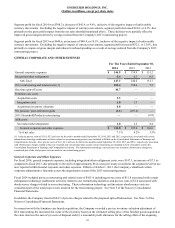
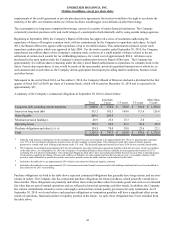
GENERAL CORPORATE AND OTHER EXPENSES
For The Years Ended September 30,
2014 2013 2012
General corporate expenses $ 146.9 $ 139.9 $ 151.2
Integration/other realignment 0.4 0.3 0.5
Sub-Total 147.3 140.2 151.7
2013 restructuring and related costs (1) 105.4 150.6 7.3
One time spin-off costs 44.7 ——
Feminine care costs:
Acquisition costs 3.5 ——
Integration costs 6.0 1.3 —
Acquisition inventory valuation 8.0 ——
Net pension / post-retirement gains (1.1)(107.6)—
2011 Household Products restructuring ——(6.8)
ASR costs:
Severance/other integration 1.0 2.5 8.4
General corporate and other expenses $ 314.8 $ 187.0 $ 160.6
% of net sales 7.1% 4.2% 3.5%
(1) Includes pre-tax costs of $11.8, $5.2 and zero for the twelve months ended September 30, 2014, 2013 and 2012, respectively, associated with certain
information technology enablement activities related to our restructuring project were included in SG&A on the Consolidated Statements of Earnings and
Comprehensive Income. Also, pre-tax costs of $1.0, $6.1 and zero for the twelve months ended September 30, 2014, 2013 and 2012, respectively, associated
with obsolescence charges related to the exit of certain non-core product lines as part of our restructuring are included in Cost of products sold on the
Consolidated Statements of Earnings and Comprehensive Income. The information technology costs and non-core inventory obsolescence charges are
considered part of the total project costs incurred for our restructuring project.
General Corporate and Other Expenses
For fiscal 2014, general corporate expenses, including integration/other realignment costs, were $147.3, an increase of $7.1 as
compared to fiscal 2013, due primarily to the shift of approximately $8 in costs previously recorded at the segment level but are
now reported within General corporate and other expenses. Effective October 1, 2013, the Company centralized certain
corporate administrative functions across the organization as part of the 2013 restructuring project.
Fiscal 2014 included pre-tax restructuring and related costs of $105.4, including pre-tax costs of $11.8 associated with certain
information technology enablement activities related to our restructuring initiatives and pre-tax costs of $1.0 associated with
obsolescence charges related to our restructuring. These information technology and inventory obsolescence costs are
considered part of the total project costs incurred for the restructuring project. See Note 5 of the Notes to Consolidated
Financial Statements.
In addition, the Company incurred $44.7 of pre-tax charges related to the proposed spin-off transaction. See Note 3 of the
Notes to Consolidated Financial Statements.
In connection with the feminine care brands acquisition, the Company recorded a pre-tax inventory valuation adjustment of
$8.0 representing the increased fair value of the inventory based on the estimated selling price of the finished goods acquired at
the close date less the sum of (a) costs of disposal and (b) a reasonable profit allowance for the selling effort of the acquiring
41