Energizer 2014 Annual Report Download - page 56
Download and view the complete annual report
Please find page 56 of the 2014 Energizer annual report below. You can navigate through the pages in the report by either clicking on the pages listed below, or by using the keyword search tool below to find specific information within the annual report.-
 1
1 -
2
-
3
-
4
-
5
-
6
-
7
-
8
-
9
-
10
-
11
-
12
-
13
-
14
-
15
-
16
-
17
-
18
-
19
-
20
-
21
-
22
-
23
-
24
-
25
-
26
-
27
-
28
-
29
-
30
-
31
-
32
-
33
-
34
-
35
-
36
-
37
-
38
-
39
-
40
-
41
-
42
-
43
-
44
-
45
-
 46
46 -
 47
47 -
 48
48 -
 49
49 -
 50
50 -
 51
51 -
 52
52 -
 53
53 -
 54
54 -
 55
55 -
 56
56 -
 57
57 -
 58
58 -
 59
59 -
 60
60 -
 61
61 -
 62
62 -
 63
63 -
 64
64 -
 65
65 -
 66
66 -
67
-
68
-
69
-
70
-
71
-
72
-
73
-
74
-
75
-
76
-
77
-
78
-
79
-
80
-
81
-
82
-
83
-
84
-
85
-
86
-
87
-
88
-
89
-
90
-
91
-
92
-
93
-
94
-
95
-
96
-
97
-
98
-
99
-
100
-
101
-
102
-
103
-
104
-
105
-
106
-
107
-
108
-
109
-
110
-
111
-
112
-
113
-
114
-
115
-
116
 |
 |
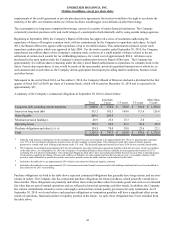
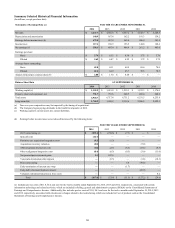
Summary Selected Historical Financial Information
(In millions, except per share data)
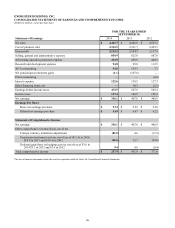
Statements of Earnings Data (a) FOR THE YEARS ENDED SEPTEMBER 30,
2014 2013 2012 2011 2010
Net sales $ 4,447.7 $ 4,466.0 $ 4,567.2 $ 4,645.7 $ 4,248.3
Depreciation and amortization 140.9 187.4 162.2 181.3 139.2
Earnings before income taxes (d) 473.5 567.9 565.4 406.0 543.4
Income taxes 117.4 160.9 156.5 144.8 140.4
Net earnings (f) $ 356.1 $ 407.0 $ 408.9 $ 261.2 $ 403.0
Earnings per share:
Basic $ 5.74 $ 6.55 $ 6.30 $ 3.75 $ 5.76
Diluted $ 5.69 $ 6.47 $ 6.22 $ 3.72 $ 5.72
Average shares outstanding:
Basic 62.0 62.1 64.9 69.6 70.0
Diluted 62.6 62.9 65.7 70.3 70.5
Annual dividend per common share (b) $ 2.00 $ 1.70 $ 0.40 $ — $ —
Balance Sheet Data AT SEPTEMBER 30,
2014 2013 2012 2011 2010
Working capital (c) $ 1,155.9 $ 1,415.0 $ 1,215.1 $ 1,233.3 $ 1,176.0
Property, plant and equipment, net 751.7 755.6 848.5 885.4 840.6
Total assets 6,928.7 6,717.4 6,731.2 6,531.5 6,255.8
Long-term debt 1,768.9 1,998.8 2,138.6 2,206.5 2,022.5
(a) Year over year comparatives may be impacted by the timing of acquisitions.
(b) The Company began paying dividends in the fourth fiscal quarter of 2012.
(c) Working capital is current assets less current liabilities.
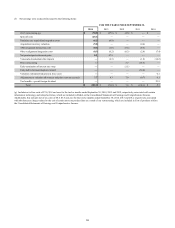
(d) Earnings before income taxes were (reduced)/increased by the following items:
FOR THE YEARS ENDED SEPTEMBER 30,
2014 2013 2012 2011 2010
2013 restructuring (e) $ (105.4) $ (150.6) $ (7.3) $ — $ —
Spin-off costs (44.7) ————
Feminine care acquisition/integration costs (9.5) (1.3) — — —
Acquisition inventory valuation (8.0) — — (7.0) —
ASR integration/transaction costs (1.0) (2.5) (8.4) (13.5) (0.5)
Other realignment/integration costs (0.4) (0.3) (0.5) (3.0) (11.0)
Net pension/post-retirement gains 1.1 107.6 — — —
Venezuela devaluation/other impacts —(6.3) — (1.8) (18.3)
Prior restructuring —— 6.8 (79.0) —
Early termination of interest rate swap —— (1.7) — —
Early debt retirement/duplicate interest —— — (22.9) —
Voluntary retirement/reduction in force costs —— — — 0.2
Total $ (167.9) $ (53.4) $ (11.1) $ (127.2) $ (29.6)
(e) Includes pre-tax costs of $11.8, $5.2 and zero for the twelve months ended September 30, 2014, 2013 and 2012, respectively, associated with certain
information technology and related activities, which are included in Selling, general and administrative expense (SG&A) on the Consolidated Statements of
Earnings and Comprehensive Income. Additionally, this includes pre-tax costs of $1.0, $6.1 and zero for the twelve months ended September 30, 2014, 2013
and 2012, respectively, associated with obsolescence charges related to the restructuring, which are included in Cost of products sold on the Consolidated
Statements of Earnings and Comprehensive Income.
52