Energizer 2014 Annual Report Download - page 74
Download and view the complete annual report
Please find page 74 of the 2014 Energizer annual report below. You can navigate through the pages in the report by either clicking on the pages listed below, or by using the keyword search tool below to find specific information within the annual report.-
 1
1 -
2
-
3
-
4
-
5
-
6
-
7
-
8
-
9
-
10
-
11
-
12
-
13
-
14
-
15
-
16
-
17
-
18
-
19
-
20
-
21
-
22
-
23
-
24
-
25
-
26
-
27
-
28
-
29
-
30
-
31
-
32
-
33
-
34
-
35
-
36
-
37
-
38
-
39
-
40
-
41
-
42
-
43
-
44
-
45
-
46
-
47
-
48
-
49
-
50
-
51
-
52
-
53
-
54
-
55
-
56
-
57
-
58
-
59
-
60
-
61
-
62
-
63
-
 64
64 -
 65
65 -
 66
66 -
 67
67 -
 68
68 -
 69
69 -
 70
70 -
 71
71 -
 72
72 -
 73
73 -
 74
74 -
 75
75 -
 76
76 -
 77
77 -
 78
78 -
 79
79 -
 80
80 -
 81
81 -
 82
82 -
 83
83 -
 84
84 -
85
-
86
-
87
-
88
-
89
-
90
-
91
-
92
-
93
-
94
-
95
-
96
-
97
-
98
-
99
-
100
-
101
-
102
-
103
-
104
-
105
-
106
-
107
-
108
-
109
-
110
-
111
-
112
-
113
-
114
-
115
-
116
 |
 |

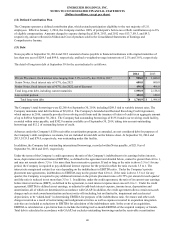
ENERGIZER HOLDINGS, INC.
NOTES TO CONSOLIDATED FINANCIAL STATEMENTS
(Dollars in millions, except per share)
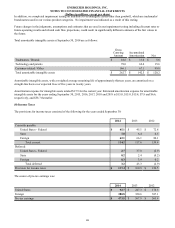
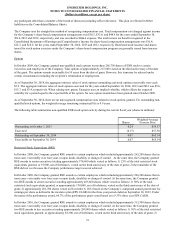
A reconciliation of income taxes with the amounts computed at the statutory federal income tax rate follows:
2014 2013 2012
Computed tax at federal statutory rate $ 165.7 35.0 % $ 198.8 35.0% $ 197.9 35.0%
State income taxes, net of federal tax benefit 2.0 0.4 5.5 1.0 4.1 0.7
Foreign tax less than the federal rate (56.9) (12.0) (47.1) (8.3) (55.6) (9.8)
Adjustments to prior years' tax accruals (7.7) (1.6) (8.3) (1.5) (7.0) (1.2)
Other taxes including repatriation of foreign earnings 15.2 3.2 17.4 3.1 16.2 2.9
Nontaxable share option (4.3) (0.9) (5.4) (1.0) (2.0) (0.4)
Other, net 3.4 0.8 — — 2.9 0.5
Total $ 117.4 24.9% $ 160.9 28.3% $ 156.5 27.7%
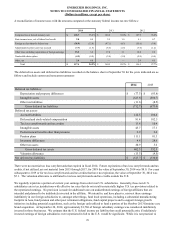
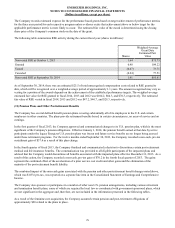
The deferred tax assets and deferred tax liabilities recorded on the balance sheet at September 30 for the years indicated are as
follows and include current and noncurrent amounts:
2014 2013
Deferred tax liabilities:
Depreciation and property differences $ (77.3)$ (83.8)
Intangible assets (623.8)(580.7)
Other tax liabilities (11.6)(8.5)
Gross deferred tax liabilities (712.7)(673.0)
Deferred tax assets:
Accrued liabilities 122.5 104.4
Deferred and stock-related compensation 81.4 102.5
Tax loss carryforwards and tax credits 13.4 10.4
Intangible assets 45.7 17.1
Postretirement benefits other than pensions 2.9 2.6
Pension plans 111.1 81.3
Inventory differences 4.4 28.6
Other tax assets 20.9 5.6
Gross deferred tax assets 402.3 352.5
Valuation allowance (13.3)(9.5)
Net deferred tax liabilities $ (323.7)$ (330.0)
There were no material tax loss carryforwards that expired in fiscal 2014. Future expirations of tax loss carryforwards and tax
credits, if not utilized, are not material from 2015 through 2017, for 2018 the value at September 30, 2014 was $8.0. For years
subsequent to 2019 or for tax loss carryforwards and tax credits that have no expiration, the value at September 30, 2014 was
$5.1. The valuation allowance is attributed to tax loss carryforwards and tax credits outside the U.S.
We regularly repatriate a portion of current year earnings from select non U.S. subsidiaries. Generally, these non-U.S.
subsidiaries are in tax jurisdictions with effective tax rates that do not result in materially higher U.S. tax provisions related to
the repatriated earnings. No provision is made for additional taxes on undistributed earnings of foreign affiliates that are
intended and planned to be indefinitely invested in the affiliate. We intend to, and have plans to, reinvest these earnings
indefinitely in our foreign subsidiaries to, amongst other things, fund local operations, including a substantial manufacturing
footprint in Asia, fund pension and other post retirement obligations, fund capital projects and to support foreign growth
initiatives including potential acquisitions, such as the foreign cash utilized to fund a portion of the October 2013 feminine care
brand acquisition. At September 30, 2014, approximately $1,760 of foreign subsidiary earnings was considered indefinitely
invested in those businesses. We estimate that the U.S. federal income tax liability that could potentially arise if indefinitely
invested earnings of foreign subsidiaries were repatriated in full to the U.S. would be significant. While it is not practical to
70