Energizer 2014 Annual Report Download - page 62
Download and view the complete annual report
Please find page 62 of the 2014 Energizer annual report below. You can navigate through the pages in the report by either clicking on the pages listed below, or by using the keyword search tool below to find specific information within the annual report.-
 1
1 -
2
-
3
-
4
-
5
-
6
-
7
-
8
-
9
-
10
-
11
-
12
-
13
-
14
-
15
-
16
-
17
-
18
-
19
-
20
-
21
-
22
-
23
-
24
-
25
-
26
-
27
-
28
-
29
-
30
-
31
-
32
-
33
-
34
-
35
-
36
-
37
-
38
-
39
-
40
-
41
-
42
-
43
-
44
-
45
-
46
-
47
-
48
-
49
-
50
-
51
-
 52
52 -
 53
53 -
 54
54 -
 55
55 -
 56
56 -
 57
57 -
 58
58 -
 59
59 -
 60
60 -
 61
61 -
 62
62 -
 63
63 -
 64
64 -
 65
65 -
 66
66 -
 67
67 -
 68
68 -
 69
69 -
 70
70 -
 71
71 -
 72
72 -
73
-
74
-
75
-
76
-
77
-
78
-
79
-
80
-
81
-
82
-
83
-
84
-
85
-
86
-
87
-
88
-
89
-
90
-
91
-
92
-
93
-
94
-
95
-
96
-
97
-
98
-
99
-
100
-
101
-
102
-
103
-
104
-
105
-
106
-
107
-
108
-
109
-
110
-
111
-
112
-
113
-
114
-
115
-
116
 |
 |

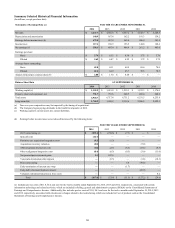
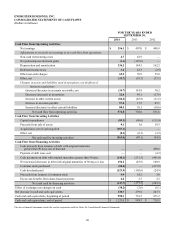
ENERGIZER HOLDINGS, INC.
CONSOLIDATED STATEMENTS OF CASH FLOWS
(Dollars in millions)
FOR THE YEARS ENDED
SEPTEMBER 30,
2014 2013 2012
Cash Flow from Operating Activities
Net earnings $ 356.1 $ 407.0 $ 408.9
Adjustments to reconcile net earnings to net cash flow from operations:
Non-cash restructuring costs 4.7 42.9 —
Net pension/post-retirement gains (1.1)(107.6)—
Depreciation and amortization 136.2 144.5 162.2
Deferred income taxes 3.2 43.3 (2.9)
Other non-cash charges 65.2 70.9 55.0
Other, net (33.7)(59.7)(37.1)
Changes in assets and liabilities used in operations, net of effects of
business acquisitions:
(Increase)/decrease in accounts receivable, net (34.7)181.8 38.2
Decrease/(increase) in inventories 22.4 45.1 (17.6)
Increase in other current assets (84.2)(45.8)(11.6)
Increase in accounts payable 57.4 17.5 47.1
Increase/(decrease) in other current liabilities 80.5 10.1 (10.6)
Net cash flow from operating activities 572.0 750.0 631.6
Cash Flow from Investing Activities
Capital expenditures (85.3)(90.6)(111.0)
Proceeds from sale of assets 9.1 1.8 19.3
Acquisitions, net of cash acquired (187.1)——
Other, net (0.1)(0.3)(3.2)
Net cash used by investing activities (263.4)(89.1)(94.9)
Cash Flow from Financing Activities
Cash proceeds from issuance of debt with original maturities
greater than 90 days, net of discount —— 498.6
Payment of debt issue cost ——(4.3)
Cash payments on debt with original maturities greater than 90 days (140.1)(231.5)(441.0)
Net increase/(decrease) in debt with original maturities of 90 days or less 194.2 (63.9) 100.9
Common stock purchased (94.4)—(417.8)
Cash dividends paid (123.9)(105.6)(24.9)
Proceeds from issuance of common stock 9.9 18.2 3.0
Excess tax benefits from share-based payments 6.6 5.3 2.2
Net cash used by financing activities (147.7)(377.5)(283.3)
Effect of exchange rate changes on cash (30.2)(3.6)(6.1)
Net increase in cash and cash equivalents 130.7 279.8 247.3
Cash and cash equivalents, beginning of period 998.3 718.5 471.2
Cash and cash equivalents, end of period $ 1,129.0 $ 998.3 $ 718.5
The above financial statements should be read in conjunction with the Notes To Consolidated Financial Statements.
58