Delta Airlines 2014 Annual Report Download - page 97
Download and view the complete annual report
Please find page 97 of the 2014 Delta Airlines annual report below. You can navigate through the pages in the report by either clicking on the pages listed below, or by using the keyword search tool below to find specific information within the annual report.-
 1
1 -
2
-
3
-
4
-
5
-
6
-
7
-
8
-
9
-
10
-
11
-
12
-
13
-
14
-
15
-
16
-
17
-
18
-
19
-
20
-
21
-
22
-
23
-
24
-
25
-
26
-
27
-
28
-
29
-
30
-
31
-
32
-
33
-
34
-
35
-
36
-
37
-
38
-
39
-
40
-
41
-
42
-
43
-
44
-
45
-
46
-
47
-
48
-
49
-
50
-
51
-
52
-
53
-
54
-
55
-
56
-
57
-
58
-
59
-
60
-
61
-
62
-
63
-
64
-
65
-
66
-
67
-
68
-
69
-
70
-
71
-
72
-
73
-
74
-
75
-
76
-
77
-
78
-
79
-
80
-
81
-
82
-
83
-
84
-
85
-
86
-
 87
87 -
 88
88 -
 89
89 -
 90
90 -
 91
91 -
 92
92 -
 93
93 -
 94
94 -
 95
95 -
 96
96 -
 97
97 -
 98
98 -
 99
99 -
 100
100 -
 101
101 -
 102
102 -
 103
103 -
 104
104 -
 105
105 -
 106
106 -
 107
107 -
108
-
109
-
110
-
111
-
112
-
113
-
114
-
115
-
116
-
117
-
118
-
119
-
120
-
121
-
122
-
123
-
124
-
125
-
126
-
127
-
128
-
129
-
130
-
131
-
132
-
133
-
134
-
135
-
136
-
137
-
138
-
139
-
140
-
141
-
142
-
143
-
144
-
145
-
146
-
147
-
148
-
149
-
150
-
151
-
152
-
153
-
154
-
155
-
156
-
157
-
158
-
159
-
160
-
161
-
162
-
163
-
164
-
165
-
166
-
167
-
168
-
169
-
170
-
171
-
172
-
173
-
174
-
175
-
176
-
177
-
178
-
179
-
180
-
181
-
182
-
183
-
184
-
185
-
186
-
187
-
188
-
189
-
190
-
191
-
192
-
193
-
194
-
195
-
196
-
197
-
198
-
199
-
200
-
201
-
202
-
203
-
204
-
205
-
206
-
207
-
208
-
209
-
210
-
211
-
212
-
213
-
214
-
215
-
216
-
217
-
218
-
219
-
220
-
221
-
222
-
223
-
224
-
225
-
226
-
227
-
228
-
229
-
230
-
231
-
232
-
233
-
234
-
235
-
236
-
237
-
238
-
239
-
240
-
241
-
242
-
243
-
244
-
245
-
246
-
247
-
248
-
249
-
250
-
251
-
252
-
253
-
254
-
255
-
256
-
257
-
258
-
259
-
260
-
261
-
262
-
263
-
264
-
265
-
266
-
267
-
268
-
269
-
270
-
271
-
272
-
273
-
274
-
275
-
276
-
277
-
278
-
279
-
280
-
281
-
282
-
283
-
284
-
285
-
286
-
287
-
288
-
289
-
290
-
291
-
292
-
293
-
294
-
295
-
296
-
297
-
298
-
299
-
300
-
301
-
302
-
303
-
304
-
305
-
306
-
307
-
308
-
309
-
310
-
311
-
312
-
313
-
314
-
315
-
316
-
317
-
318
-
319
-
320
-
321
-
322
-
323
-
324
-
325
-
326
-
327
-
328
-
329
-
330
-
331
-
332
-
333
-
334
-
335
-
336
-
337
-
338
-
339
-
340
-
341
-
342
-
343
-
344
-
345
-
346
-
347
-
348
-
349
-
350
-
351
-
352
-
353
-
354
-
355
-
356
-
357
-
358
-
359
-
360
-
361
-
362
-
363
-
364
-
365
-
366
-
367
-
368
-
369
-
370
-
371
-
372
-
373
-
374
-
375
-
376
-
377
-
378
-
379
-
380
-
381
-
382
-
383
-
384
-
385
-
386
-
387
-
388
-
389
-
390
-
391
-
392
-
393
-
394
-
395
-
396
-
397
-
398
-
399
-
400
-
401
-
402
-
403
-
404
-
405
-
406
-
407
-
408
-
409
-
410
-
411
-
412
-
413
-
414
-
415
-
416
-
417
-
418
-
419
-
420
-
421
-
422
-
423
-
424
-
425
-
426
-
427
-
428
-
429
-
430
-
431
-
432
-
433
-
434
-
435
-
436
-
437
-
438
-
439
-
440
-
441
-
442
-
443
-
444
-
445
-
446
-
447
-
448
-
449
-
450
-
451
-
452
-
453
-
454
-
455
-
456
 |
 |

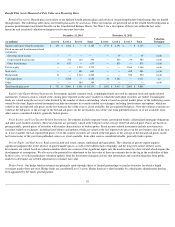
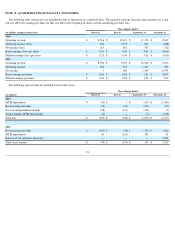
NOTE 15 . ACCUMULATED OTHER COMPREHENSIVE LOSS
The following table shows the components of accumulated other comprehensive loss:
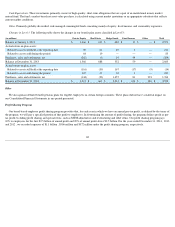
NOTE 16 . GEOGRAPHIC INFORMATION
Operating revenue for the airline segment is assigned to a specific geographic region based on the origin, flight path and destination of each flight
segment. The majority of the revenues of the refinery, consisting of fuel sales to the airline, have been eliminated in the Consolidated Financial
Statements. The remaining operating revenue for the refinery segment is included in the domestic region. For information regarding our segment
information, see Note 2 .
Our operating revenue by geographic region (as defined by the DOT) is summarized in the following table:
Our tangible assets consist primarily of flight equipment, which is mobile across geographic markets. Accordingly, assets are not allocated to
specific geographic regions.
90
(in millions)
Pension and
Other Benefits
Liabilities Derivative
Contracts
(3)
Investments Total
Balance at January 1, 2012
$
(6,288
)
$
(474
)
(4
)
$
(6,766
)
Changes in value (net of tax effect of $0)
(2,168
)
196
(3
)
(1,975
)
Reclassification into earnings (net of tax effect of $0)
(1)
149
15
—
164
Balance at December 31, 2012
(8,307
)
(263
)
(7
)
(8,577
)
Changes in value (net of tax effect of $0)
2,760
296
(19
)
3,037
Reclassification into earnings (net of tax effect of $321)
(1)
224
186
—
410
Balance at December 31, 2013
(2)
(5,323
)
219
(26
)
(5,130
)
Changes in value (net of tax effect of $1,276)
(2,267
)
83
10
(2,174
)
Reclassification into earnings (net of tax effect of $4)
(1)
73
(80
)
—
(
7
)
Balance at December 31, 2014
(2)
$
(7,517
)
$
222
$
(16
)
$
(7,311
)
(1)
Amounts reclassified from AOCI for pension and other benefits liabilities are recorded in salaries and related costs in the Consolidated Statements of Operations. Amounts reclassified
from AOCI for derivative contracts designated as foreign currency cash flow hedges and interest rate cash flow hedges are recorded in passenger revenue and interest expense, net,
respectively, in the Consolidated Statements of Operations. Amounts reclassified from AOCI for investments are recorded in interest income in the Consolidated Statements of
Operations.
(2)
Includes $1.9 billion of deferred income tax expense, primarily related to pension obligations, that will not be recognized in net income until the pension obligations are fully
extinguished, which is not expected to occur for at least 25 years.
(3)
Included $321 million of deferred income tax expense that remained in AOCI until December 2013 when all amounts in AOCI that related to derivative contracts designated as fuel
cash flow hedges were recognized in the Consolidated Statement of Operations.
Year Ended December 31,
(in millions) 2014 2013 2012
Domestic
$
26,898
$
24,857
$
23,989
Atlantic
6,757
6,446
6,329
Pacific
3,948
4,086
4,198
Latin America
2,759
2,384
2,154
Total
$
40,362
$
37,773
$
36,670