Delta Airlines 2014 Annual Report Download - page 34
Download and view the complete annual report
Please find page 34 of the 2014 Delta Airlines annual report below. You can navigate through the pages in the report by either clicking on the pages listed below, or by using the keyword search tool below to find specific information within the annual report.-
 1
1 -
2
-
3
-
4
-
5
-
6
-
7
-
8
-
9
-
10
-
11
-
12
-
13
-
14
-
15
-
16
-
17
-
18
-
19
-
20
-
21
-
22
-
23
-
 24
24 -
 25
25 -
 26
26 -
 27
27 -
 28
28 -
 29
29 -
 30
30 -
 31
31 -
 32
32 -
 33
33 -
 34
34 -
 35
35 -
 36
36 -
 37
37 -
 38
38 -
 39
39 -
 40
40 -
 41
41 -
 42
42 -
 43
43 -
 44
44 -
45
-
46
-
47
-
48
-
49
-
50
-
51
-
52
-
53
-
54
-
55
-
56
-
57
-
58
-
59
-
60
-
61
-
62
-
63
-
64
-
65
-
66
-
67
-
68
-
69
-
70
-
71
-
72
-
73
-
74
-
75
-
76
-
77
-
78
-
79
-
80
-
81
-
82
-
83
-
84
-
85
-
86
-
87
-
88
-
89
-
90
-
91
-
92
-
93
-
94
-
95
-
96
-
97
-
98
-
99
-
100
-
101
-
102
-
103
-
104
-
105
-
106
-
107
-
108
-
109
-
110
-
111
-
112
-
113
-
114
-
115
-
116
-
117
-
118
-
119
-
120
-
121
-
122
-
123
-
124
-
125
-
126
-
127
-
128
-
129
-
130
-
131
-
132
-
133
-
134
-
135
-
136
-
137
-
138
-
139
-
140
-
141
-
142
-
143
-
144
-
145
-
146
-
147
-
148
-
149
-
150
-
151
-
152
-
153
-
154
-
155
-
156
-
157
-
158
-
159
-
160
-
161
-
162
-
163
-
164
-
165
-
166
-
167
-
168
-
169
-
170
-
171
-
172
-
173
-
174
-
175
-
176
-
177
-
178
-
179
-
180
-
181
-
182
-
183
-
184
-
185
-
186
-
187
-
188
-
189
-
190
-
191
-
192
-
193
-
194
-
195
-
196
-
197
-
198
-
199
-
200
-
201
-
202
-
203
-
204
-
205
-
206
-
207
-
208
-
209
-
210
-
211
-
212
-
213
-
214
-
215
-
216
-
217
-
218
-
219
-
220
-
221
-
222
-
223
-
224
-
225
-
226
-
227
-
228
-
229
-
230
-
231
-
232
-
233
-
234
-
235
-
236
-
237
-
238
-
239
-
240
-
241
-
242
-
243
-
244
-
245
-
246
-
247
-
248
-
249
-
250
-
251
-
252
-
253
-
254
-
255
-
256
-
257
-
258
-
259
-
260
-
261
-
262
-
263
-
264
-
265
-
266
-
267
-
268
-
269
-
270
-
271
-
272
-
273
-
274
-
275
-
276
-
277
-
278
-
279
-
280
-
281
-
282
-
283
-
284
-
285
-
286
-
287
-
288
-
289
-
290
-
291
-
292
-
293
-
294
-
295
-
296
-
297
-
298
-
299
-
300
-
301
-
302
-
303
-
304
-
305
-
306
-
307
-
308
-
309
-
310
-
311
-
312
-
313
-
314
-
315
-
316
-
317
-
318
-
319
-
320
-
321
-
322
-
323
-
324
-
325
-
326
-
327
-
328
-
329
-
330
-
331
-
332
-
333
-
334
-
335
-
336
-
337
-
338
-
339
-
340
-
341
-
342
-
343
-
344
-
345
-
346
-
347
-
348
-
349
-
350
-
351
-
352
-
353
-
354
-
355
-
356
-
357
-
358
-
359
-
360
-
361
-
362
-
363
-
364
-
365
-
366
-
367
-
368
-
369
-
370
-
371
-
372
-
373
-
374
-
375
-
376
-
377
-
378
-
379
-
380
-
381
-
382
-
383
-
384
-
385
-
386
-
387
-
388
-
389
-
390
-
391
-
392
-
393
-
394
-
395
-
396
-
397
-
398
-
399
-
400
-
401
-
402
-
403
-
404
-
405
-
406
-
407
-
408
-
409
-
410
-
411
-
412
-
413
-
414
-
415
-
416
-
417
-
418
-
419
-
420
-
421
-
422
-
423
-
424
-
425
-
426
-
427
-
428
-
429
-
430
-
431
-
432
-
433
-
434
-
435
-
436
-
437
-
438
-
439
-
440
-
441
-
442
-
443
-
444
-
445
-
446
-
447
-
448
-
449
-
450
-
451
-
452
-
453
-
454
-
455
-
456
 |
 |

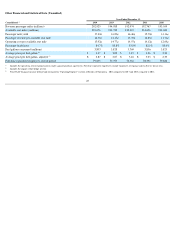
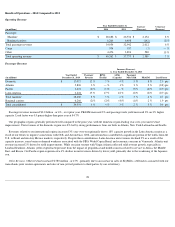
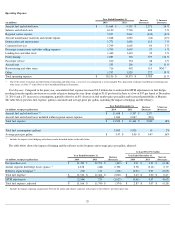
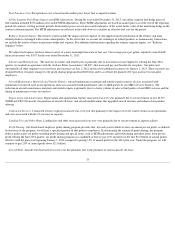
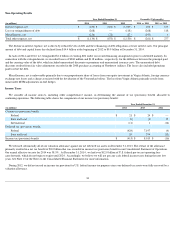
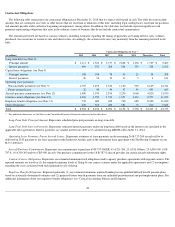
Operating Expense
Fuel Expense. Compared to the prior year, consolidated fuel expense increased $2.0 billion due to unfavorable MTM adjustments on fuel hedges
resulting from the significant decrease in crude oil prices during the year (from a high of $115 per barrel in June to a low of $57 per barrel at December
31, 2014) and a 2% increase in consumption, partially offset by an 8% decrease in fuel market price per gallon and increased profitability at Monroe.
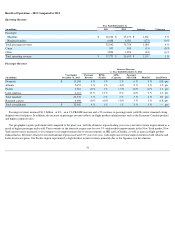
The table below presents fuel expense, gallons consumed and average price per gallon, including the impact of hedging and the refinery:
The table below shows the impact of hedging and the refinery on fuel expense and average price per gallon, adjusted:
29
Year Ended December 31, Increase
(Decrease) % Increase
(Decrease) (in millions) 2014 2013
Aircraft fuel and related taxes
$
11,668
$
9,397
$
2,271
24
%
Salaries and related costs
8,120
7,720
400
5
%
Regional carrier expense
5,237
5,669
(432
)
(8
)%
Aircraft maintenance materials and outside repairs
1,828
1,852
(24
)
(1
)%
Depreciation and amortization
1,771
1,658
113
7
%
Contracted services
1,749
1,665
84
5
%
Passenger commissions and other selling expenses
1,700
1,603
97
6
%
Landing fees and other rents
1,442
1,410
32
2
%
Profit sharing
1,085
506
579
114
%
Passenger service
810
762
48
6
%
Aircraft rent
233
209
24
11
%
Restructuring and other items
716
402
314
NM
(1)
Other
1,797
1,520
277
18
%
Total operating expense
$
38,156
$
34,373
$
3,783
11
%
(1)
Due to the nature of amounts recorded within restructuring and other items, a year-over-year comparison is not meaningful. For a discussion of charges recorded in restructuring and
other items, see Note 17 of the Notes to the Consolidated Financial Statements.
Year Ended December 31, Increase
(Decrease) % Increase
(Decrease) (in millions, except per gallon data) 2014 2013
Aircraft fuel and related taxes
(1)
$
11,668
$
9,397
$
2,271
Aircraft fuel and related taxes included within regional carrier expense
1,844
2,067
(223
)
Total fuel expense
$
13,512
$
11,464
$
2,048
18
%
Total fuel consumption (gallons)
3,893
3,828
65
2
%
Average price per gallon
$
3.47
$
3.00
$
0.47
16
%
(1)
Includes the impact of fuel hedging and refinery results described further in the table below.
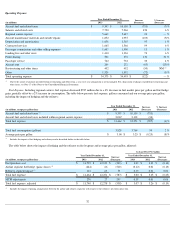
Average Price Per Gallon
Year Ended December 31, Increase
(Decrease)
Year Ended December 31, Increase
(Decrease) (in millions, except per gallon data) 2014 2013 2014 2013
Fuel purchase cost
$
11,350
$
11,792
$
(442
)
$
2.91
$
3.09
$
(0.18
)
Airline segment fuel hedge losses (gains)
(1)
2,258
(444
)
2,702
0.58
(0.12
)
0.70
Refinery segment impact
(1)
(96
)
116
(212
)
(0.02
)
0.03
(0.05
)
Total fuel expense
$
13,512
$
11,464
$
2,048
$
3.47
$
3.00
$
0.47
MTM adjustments
(2,346
)
276
(2,622
)
(0.60
)
0.07
(0.67
)
Total fuel expense, adjusted
$
11,166
$
11,740
$
(574
)
$
2.87
$
3.07
$
(0.20
)
(1)
Includes the impact of pricing arrangements between the airline and refinery segments with respect to the refinery's inventory price risk.