Delta Airlines 2014 Annual Report Download - page 38
Download and view the complete annual report
Please find page 38 of the 2014 Delta Airlines annual report below. You can navigate through the pages in the report by either clicking on the pages listed below, or by using the keyword search tool below to find specific information within the annual report.-
 1
1 -
2
-
3
-
4
-
5
-
6
-
7
-
8
-
9
-
10
-
11
-
12
-
13
-
14
-
15
-
16
-
17
-
18
-
19
-
20
-
21
-
22
-
23
-
24
-
25
-
26
-
27
-
 28
28 -
 29
29 -
 30
30 -
 31
31 -
 32
32 -
 33
33 -
 34
34 -
 35
35 -
 36
36 -
 37
37 -
 38
38 -
 39
39 -
 40
40 -
 41
41 -
 42
42 -
 43
43 -
 44
44 -
 45
45 -
 46
46 -
 47
47 -
 48
48 -
49
-
50
-
51
-
52
-
53
-
54
-
55
-
56
-
57
-
58
-
59
-
60
-
61
-
62
-
63
-
64
-
65
-
66
-
67
-
68
-
69
-
70
-
71
-
72
-
73
-
74
-
75
-
76
-
77
-
78
-
79
-
80
-
81
-
82
-
83
-
84
-
85
-
86
-
87
-
88
-
89
-
90
-
91
-
92
-
93
-
94
-
95
-
96
-
97
-
98
-
99
-
100
-
101
-
102
-
103
-
104
-
105
-
106
-
107
-
108
-
109
-
110
-
111
-
112
-
113
-
114
-
115
-
116
-
117
-
118
-
119
-
120
-
121
-
122
-
123
-
124
-
125
-
126
-
127
-
128
-
129
-
130
-
131
-
132
-
133
-
134
-
135
-
136
-
137
-
138
-
139
-
140
-
141
-
142
-
143
-
144
-
145
-
146
-
147
-
148
-
149
-
150
-
151
-
152
-
153
-
154
-
155
-
156
-
157
-
158
-
159
-
160
-
161
-
162
-
163
-
164
-
165
-
166
-
167
-
168
-
169
-
170
-
171
-
172
-
173
-
174
-
175
-
176
-
177
-
178
-
179
-
180
-
181
-
182
-
183
-
184
-
185
-
186
-
187
-
188
-
189
-
190
-
191
-
192
-
193
-
194
-
195
-
196
-
197
-
198
-
199
-
200
-
201
-
202
-
203
-
204
-
205
-
206
-
207
-
208
-
209
-
210
-
211
-
212
-
213
-
214
-
215
-
216
-
217
-
218
-
219
-
220
-
221
-
222
-
223
-
224
-
225
-
226
-
227
-
228
-
229
-
230
-
231
-
232
-
233
-
234
-
235
-
236
-
237
-
238
-
239
-
240
-
241
-
242
-
243
-
244
-
245
-
246
-
247
-
248
-
249
-
250
-
251
-
252
-
253
-
254
-
255
-
256
-
257
-
258
-
259
-
260
-
261
-
262
-
263
-
264
-
265
-
266
-
267
-
268
-
269
-
270
-
271
-
272
-
273
-
274
-
275
-
276
-
277
-
278
-
279
-
280
-
281
-
282
-
283
-
284
-
285
-
286
-
287
-
288
-
289
-
290
-
291
-
292
-
293
-
294
-
295
-
296
-
297
-
298
-
299
-
300
-
301
-
302
-
303
-
304
-
305
-
306
-
307
-
308
-
309
-
310
-
311
-
312
-
313
-
314
-
315
-
316
-
317
-
318
-
319
-
320
-
321
-
322
-
323
-
324
-
325
-
326
-
327
-
328
-
329
-
330
-
331
-
332
-
333
-
334
-
335
-
336
-
337
-
338
-
339
-
340
-
341
-
342
-
343
-
344
-
345
-
346
-
347
-
348
-
349
-
350
-
351
-
352
-
353
-
354
-
355
-
356
-
357
-
358
-
359
-
360
-
361
-
362
-
363
-
364
-
365
-
366
-
367
-
368
-
369
-
370
-
371
-
372
-
373
-
374
-
375
-
376
-
377
-
378
-
379
-
380
-
381
-
382
-
383
-
384
-
385
-
386
-
387
-
388
-
389
-
390
-
391
-
392
-
393
-
394
-
395
-
396
-
397
-
398
-
399
-
400
-
401
-
402
-
403
-
404
-
405
-
406
-
407
-
408
-
409
-
410
-
411
-
412
-
413
-
414
-
415
-
416
-
417
-
418
-
419
-
420
-
421
-
422
-
423
-
424
-
425
-
426
-
427
-
428
-
429
-
430
-
431
-
432
-
433
-
434
-
435
-
436
-
437
-
438
-
439
-
440
-
441
-
442
-
443
-
444
-
445
-
446
-
447
-
448
-
449
-
450
-
451
-
452
-
453
-
454
-
455
-
456
 |
 |

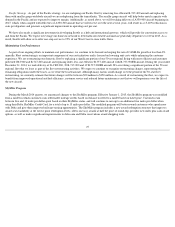
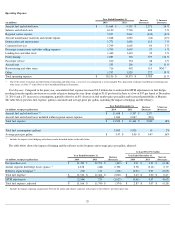
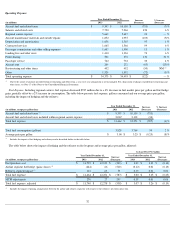
Fuel Purchase Cost. Fuel purchase cost is based on the market price for jet fuel at airport locations.
Airline Segment Fuel Hedge Impact and MTM Adjustments. During the year ended December 31, 2013, our airline segment fuel hedge gains of
$444 million included $276 million of favorable MTM adjustments. These MTM adjustments are based on market prices as of the end of the reporting
period for contracts settling in future periods. Such market prices are not necessarily indicative of the actual future value of the underlying hedge in the
contract settlement period. The MTM adjustments are reflected in the table above to calculate an effective fuel cost for the period.
Refinery Segment Impact. The refinery results include the impact on fuel expense of self-supply from the production of the refinery and from
refined products exchanged with certain counterparties. To the extent that we account for exchanges of refined products as nonmonetary transactions,
we include the results of those transactions within fuel expense. For additional information regarding the refinery segment impact, see "Refinery
Segment" below.
We adjust fuel expense for these items to arrive at a more meaningful measure of fuel cost. Our average price per gallon, adjusted (a non-GAAP
financial measure) was $3.07 for the year ended December 31, 2013.
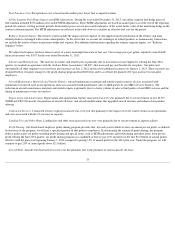
Salaries and Related Costs . The increase in salaries and related costs is primarily due to investments in our employees. During the June 2012
quarter, we reached an agreement with the Air Line Pilots Association ("ALPA") that increased pay and benefits for our pilots. Our pilots and
substantially all other employees received base pay increases on July 1, 2012 and received additional increases on January 1, 2013. These increases are
designed both to recognize changes to the profit sharing program described below and to accelerate the planned 2013 pay increase for non-pilot
employees.
Aircraft Maintenance Materials and Outside Repairs. Aircraft maintenance materials and outside repairs consists of costs associated with
maintenance of aircraft used in our operations and costs associated with maintenance sales to third parties by our MRO services business. The
reduction in aircraft maintenance materials and outside repairs is primarily due to a lower volume of sales to third parties of our MRO services and the
timing of maintenance events on our fleet.
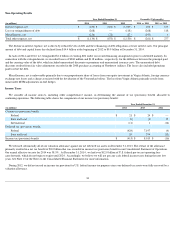
Depreciation and Amortization. Depreciation and amortization expense increased year-over-year primarily due to our investment in new B-737-
900ER and CRJ-900 aircraft, the purchase of aircraft off-lease, and aircraft modifications that upgraded aircraft interiors and enhanced our product
offering.
Contracted Services. Contracted services expense increased year-over-year due primarily to the impact of severe winter storms on our operations
and costs associated with the 1% increase in capacity.
Landing Fees and Other Rents. Landing fees and other rents increased year-over-year primarily due to our investment in airport facilities.
Profit Sharing. Our broad-based employee profit sharing program provides that, for each year in which we have an annual pre-
tax profit, as defined
by the terms of the program, we will pay a specified portion of that profit to employees. In determining the amount of profit sharing, the program
defines profit as pre-tax profit excluding profit sharing and special items, such as MTM adjustments and restructuring and other items, from pre-tax
profit. During the June 2012 quarter, our profit sharing program was modified so that we pay 10% of profits on the first $2.5 billion of annual profits
effective with the plan year beginning January 1, 2013 compared to paying 15% of annual profit for the 2012 plan year. Under the program, we will
continue to pay 20% of annual profit above $2.5 billion.
Aircraft Rent. Aircraft rent decreased year-over-year due primarily due to the purchase of various aircraft off-lease.
33