Delta Airlines 2014 Annual Report Download - page 94
Download and view the complete annual report
Please find page 94 of the 2014 Delta Airlines annual report below. You can navigate through the pages in the report by either clicking on the pages listed below, or by using the keyword search tool below to find specific information within the annual report.-
 1
1 -
2
-
3
-
4
-
5
-
6
-
7
-
8
-
9
-
10
-
11
-
12
-
13
-
14
-
15
-
16
-
17
-
18
-
19
-
20
-
21
-
22
-
23
-
24
-
25
-
26
-
27
-
28
-
29
-
30
-
31
-
32
-
33
-
34
-
35
-
36
-
37
-
38
-
39
-
40
-
41
-
42
-
43
-
44
-
45
-
46
-
47
-
48
-
49
-
50
-
51
-
52
-
53
-
54
-
55
-
56
-
57
-
58
-
59
-
60
-
61
-
62
-
63
-
64
-
65
-
66
-
67
-
68
-
69
-
70
-
71
-
72
-
73
-
74
-
75
-
76
-
77
-
78
-
79
-
80
-
81
-
82
-
83
-
 84
84 -
 85
85 -
 86
86 -
 87
87 -
 88
88 -
 89
89 -
 90
90 -
 91
91 -
 92
92 -
 93
93 -
 94
94 -
 95
95 -
 96
96 -
 97
97 -
 98
98 -
 99
99 -
 100
100 -
 101
101 -
 102
102 -
 103
103 -
 104
104 -
105
-
106
-
107
-
108
-
109
-
110
-
111
-
112
-
113
-
114
-
115
-
116
-
117
-
118
-
119
-
120
-
121
-
122
-
123
-
124
-
125
-
126
-
127
-
128
-
129
-
130
-
131
-
132
-
133
-
134
-
135
-
136
-
137
-
138
-
139
-
140
-
141
-
142
-
143
-
144
-
145
-
146
-
147
-
148
-
149
-
150
-
151
-
152
-
153
-
154
-
155
-
156
-
157
-
158
-
159
-
160
-
161
-
162
-
163
-
164
-
165
-
166
-
167
-
168
-
169
-
170
-
171
-
172
-
173
-
174
-
175
-
176
-
177
-
178
-
179
-
180
-
181
-
182
-
183
-
184
-
185
-
186
-
187
-
188
-
189
-
190
-
191
-
192
-
193
-
194
-
195
-
196
-
197
-
198
-
199
-
200
-
201
-
202
-
203
-
204
-
205
-
206
-
207
-
208
-
209
-
210
-
211
-
212
-
213
-
214
-
215
-
216
-
217
-
218
-
219
-
220
-
221
-
222
-
223
-
224
-
225
-
226
-
227
-
228
-
229
-
230
-
231
-
232
-
233
-
234
-
235
-
236
-
237
-
238
-
239
-
240
-
241
-
242
-
243
-
244
-
245
-
246
-
247
-
248
-
249
-
250
-
251
-
252
-
253
-
254
-
255
-
256
-
257
-
258
-
259
-
260
-
261
-
262
-
263
-
264
-
265
-
266
-
267
-
268
-
269
-
270
-
271
-
272
-
273
-
274
-
275
-
276
-
277
-
278
-
279
-
280
-
281
-
282
-
283
-
284
-
285
-
286
-
287
-
288
-
289
-
290
-
291
-
292
-
293
-
294
-
295
-
296
-
297
-
298
-
299
-
300
-
301
-
302
-
303
-
304
-
305
-
306
-
307
-
308
-
309
-
310
-
311
-
312
-
313
-
314
-
315
-
316
-
317
-
318
-
319
-
320
-
321
-
322
-
323
-
324
-
325
-
326
-
327
-
328
-
329
-
330
-
331
-
332
-
333
-
334
-
335
-
336
-
337
-
338
-
339
-
340
-
341
-
342
-
343
-
344
-
345
-
346
-
347
-
348
-
349
-
350
-
351
-
352
-
353
-
354
-
355
-
356
-
357
-
358
-
359
-
360
-
361
-
362
-
363
-
364
-
365
-
366
-
367
-
368
-
369
-
370
-
371
-
372
-
373
-
374
-
375
-
376
-
377
-
378
-
379
-
380
-
381
-
382
-
383
-
384
-
385
-
386
-
387
-
388
-
389
-
390
-
391
-
392
-
393
-
394
-
395
-
396
-
397
-
398
-
399
-
400
-
401
-
402
-
403
-
404
-
405
-
406
-
407
-
408
-
409
-
410
-
411
-
412
-
413
-
414
-
415
-
416
-
417
-
418
-
419
-
420
-
421
-
422
-
423
-
424
-
425
-
426
-
427
-
428
-
429
-
430
-
431
-
432
-
433
-
434
-
435
-
436
-
437
-
438
-
439
-
440
-
441
-
442
-
443
-
444
-
445
-
446
-
447
-
448
-
449
-
450
-
451
-
452
-
453
-
454
-
455
-
456
 |
 |

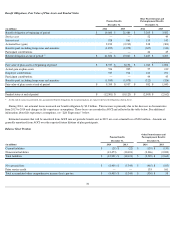
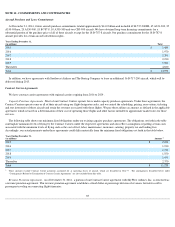
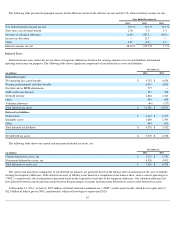
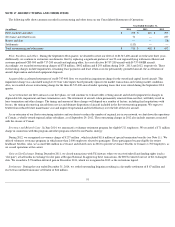
The following table presents the principal reasons for the difference between the effective tax rate and the U.S. federal statutory income tax rate:
Deferred Taxes
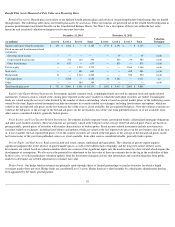
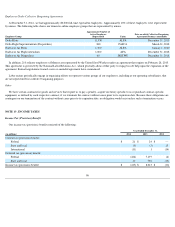
Deferred income taxes reflect the net tax effect of temporary differences between the carrying amounts of assets and liabilities for financial
reporting and income tax purposes. The following table shows significant components of our deferred tax assets and liabilities:
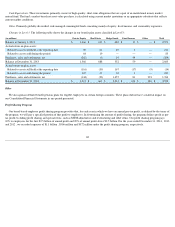
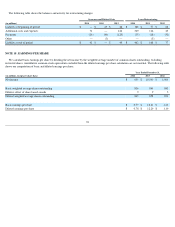
The following table shows our current and noncurrent deferred tax assets, net:
The current and noncurrent components of our deferred tax balances are generally based on the balance sheet classification of the asset or liability
creating the temporary difference. If the deferred tax asset or liability is not based on a component of our balance sheet, such as our net operating loss
(“NOL”) carryforwards, the classification is presented based on the expected reversal date of the temporary difference. Our valuation allowance has
been allocated between current and noncurrent based on the percentages of current and noncurrent deferred tax assets to total deferred tax assets.
At December 31, 2014 , we had (1) $357 million of federal alternative minimum tax (“AMT”) credit carryforwards, which do not expire and (2)
$12.0 billion of federal pre-tax NOL carryforwards, which will not begin to expire until 2024 .
87
Year Ended December 31,
2014 2013 2012
U.S. federal statutory income tax rate
35.0
%
35.0
%
35.0
%
State taxes, net of federal benefit
2.00
3.0
3.3
Decrease in valuation allowance
(2.40
)
(367.5
)
(40.8
)
Income tax allocation
—
12.7
—
Other
3.90
(0.4
)
4.0
Effective income tax rate
38.50
%
(317.2
)%
1.5
%
December 31,
(in millions) 2014 2013
Deferred tax assets:
Net operating loss carryforwards
$
4,782
$
6,024
Pension, postretirement and other benefits
6,033
4,982
Fuel derivatives MTM adjustments
777
—
AMT credit carryforward
357
378
Deferred revenue
1,824
1,965
Other
659
698
Valuation allowance
(46
)
(177
)
Total deferred tax assets
$
14,386
$
13,870
Deferred tax liabilities:
Depreciation
$
4,663
$
4,799
Intangible assets
1,684
1,704
Other
444
639
Total deferred tax liabilities
$
6,791
$
7,142
Net deferred tax assets
$
7,595
$
6,728
December 31,
(in millions) 2014 2013
Current deferred tax assets, net
$
3,275
$
1,736
Noncurrent deferred tax assets, net
4,320
4,992
Total deferred tax assets, net
$
7,595
$
6,728