Delta Airlines 2014 Annual Report Download - page 46
Download and view the complete annual report
Please find page 46 of the 2014 Delta Airlines annual report below. You can navigate through the pages in the report by either clicking on the pages listed below, or by using the keyword search tool below to find specific information within the annual report.-
 1
1 -
2
-
3
-
4
-
5
-
6
-
7
-
8
-
9
-
10
-
11
-
12
-
13
-
14
-
15
-
16
-
17
-
18
-
19
-
20
-
21
-
22
-
23
-
24
-
25
-
26
-
27
-
28
-
29
-
30
-
31
-
32
-
33
-
34
-
35
-
 36
36 -
 37
37 -
 38
38 -
 39
39 -
 40
40 -
 41
41 -
 42
42 -
 43
43 -
 44
44 -
 45
45 -
 46
46 -
 47
47 -
 48
48 -
 49
49 -
 50
50 -
 51
51 -
 52
52 -
 53
53 -
 54
54 -
 55
55 -
 56
56 -
57
-
58
-
59
-
60
-
61
-
62
-
63
-
64
-
65
-
66
-
67
-
68
-
69
-
70
-
71
-
72
-
73
-
74
-
75
-
76
-
77
-
78
-
79
-
80
-
81
-
82
-
83
-
84
-
85
-
86
-
87
-
88
-
89
-
90
-
91
-
92
-
93
-
94
-
95
-
96
-
97
-
98
-
99
-
100
-
101
-
102
-
103
-
104
-
105
-
106
-
107
-
108
-
109
-
110
-
111
-
112
-
113
-
114
-
115
-
116
-
117
-
118
-
119
-
120
-
121
-
122
-
123
-
124
-
125
-
126
-
127
-
128
-
129
-
130
-
131
-
132
-
133
-
134
-
135
-
136
-
137
-
138
-
139
-
140
-
141
-
142
-
143
-
144
-
145
-
146
-
147
-
148
-
149
-
150
-
151
-
152
-
153
-
154
-
155
-
156
-
157
-
158
-
159
-
160
-
161
-
162
-
163
-
164
-
165
-
166
-
167
-
168
-
169
-
170
-
171
-
172
-
173
-
174
-
175
-
176
-
177
-
178
-
179
-
180
-
181
-
182
-
183
-
184
-
185
-
186
-
187
-
188
-
189
-
190
-
191
-
192
-
193
-
194
-
195
-
196
-
197
-
198
-
199
-
200
-
201
-
202
-
203
-
204
-
205
-
206
-
207
-
208
-
209
-
210
-
211
-
212
-
213
-
214
-
215
-
216
-
217
-
218
-
219
-
220
-
221
-
222
-
223
-
224
-
225
-
226
-
227
-
228
-
229
-
230
-
231
-
232
-
233
-
234
-
235
-
236
-
237
-
238
-
239
-
240
-
241
-
242
-
243
-
244
-
245
-
246
-
247
-
248
-
249
-
250
-
251
-
252
-
253
-
254
-
255
-
256
-
257
-
258
-
259
-
260
-
261
-
262
-
263
-
264
-
265
-
266
-
267
-
268
-
269
-
270
-
271
-
272
-
273
-
274
-
275
-
276
-
277
-
278
-
279
-
280
-
281
-
282
-
283
-
284
-
285
-
286
-
287
-
288
-
289
-
290
-
291
-
292
-
293
-
294
-
295
-
296
-
297
-
298
-
299
-
300
-
301
-
302
-
303
-
304
-
305
-
306
-
307
-
308
-
309
-
310
-
311
-
312
-
313
-
314
-
315
-
316
-
317
-
318
-
319
-
320
-
321
-
322
-
323
-
324
-
325
-
326
-
327
-
328
-
329
-
330
-
331
-
332
-
333
-
334
-
335
-
336
-
337
-
338
-
339
-
340
-
341
-
342
-
343
-
344
-
345
-
346
-
347
-
348
-
349
-
350
-
351
-
352
-
353
-
354
-
355
-
356
-
357
-
358
-
359
-
360
-
361
-
362
-
363
-
364
-
365
-
366
-
367
-
368
-
369
-
370
-
371
-
372
-
373
-
374
-
375
-
376
-
377
-
378
-
379
-
380
-
381
-
382
-
383
-
384
-
385
-
386
-
387
-
388
-
389
-
390
-
391
-
392
-
393
-
394
-
395
-
396
-
397
-
398
-
399
-
400
-
401
-
402
-
403
-
404
-
405
-
406
-
407
-
408
-
409
-
410
-
411
-
412
-
413
-
414
-
415
-
416
-
417
-
418
-
419
-
420
-
421
-
422
-
423
-
424
-
425
-
426
-
427
-
428
-
429
-
430
-
431
-
432
-
433
-
434
-
435
-
436
-
437
-
438
-
439
-
440
-
441
-
442
-
443
-
444
-
445
-
446
-
447
-
448
-
449
-
450
-
451
-
452
-
453
-
454
-
455
-
456
 |
 |

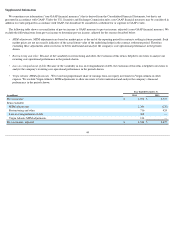
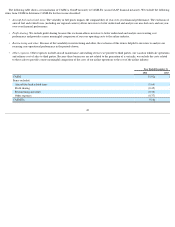
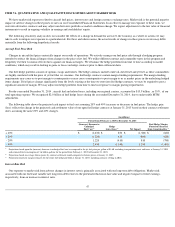
We assessed each of the above assumptions in our most recent impairment analyses. The combination of our most recently completed annual
results and our projected revenues, expenses and cash flows more than offset any negative events and circumstances. The stabilizing operating
environment for U.S. airlines has resulted in annual yields increasing along with load factors, leading to improved financial results.
Goodwill . Our goodwill balance, which is related to the airline segment, was $9.8 billion at December 31, 2014 . We determined that there was no
indication that Goodwill was impaired based upon our qualitative assessment of all relevant factors, including applicable factors noted in " Key
Assumptions
" above.
Identifiable Intangible Assets. Our identifiable intangible assets, which are related to the airline segment, had a net carrying amount of $4.6 billion
at December 31, 2014 , of which $4.4 billion related to indefinite-lived intangible assets. Indefinite-
lived assets are not amortized and consist primarily
of routes, slots, the Delta tradename and assets related to SkyTeam and collaborative arrangements. Definite-lived assets consist primarily of
marketing and partner agreements.
In 2014 , we performed a quantitative assessment of our Pacific routes and slots indefinite-lived intangible asset and determined that there was no
indication that the asset was impaired. We obtained this asset as part of the acquisition of Northwest Airlines in 2008 and is composed of Pacific route
authorities and takeoff and landing rights (“slots”) at Tokyo-Narita International Airport ("Narita"). This intangible asset supports Delta’s Narita hub
activities and is essential to Delta's Pacific network. As of the 2014 assessment, the estimated fair value of the Pacific routes and slots intangible asset
exceeded the $2.2 billion carrying value by approximately 20%. Changes in key inputs and assumptions, including (1) our strategy related to the
composition of our Pacific network and flying, (2) new or enhanced joint ventures or alliances, (3) foreign currency exchange rates, (4) fuel costs and
(5) Pacific region profitability, could impact the value of this asset in the future.
We performed a qualitative assessment of all other indefinite-lived intangible assets and determined that there was no indication that our indefinite-
lived intangible assets were impaired. The qualitative assessments included analyses and weighting of all relevant factors, including the applicable
factors noted above, which impact the fair value of our indefinite-lived intangible assets.
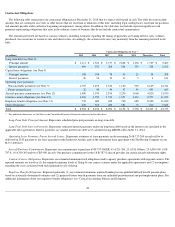
Long
-Lived Assets
Our flight equipment and other long-lived assets have a recorded value of $21.9 billion at December 31, 2014 . This value is based on various
factors, including the assets' estimated useful lives and salvage values. We record impairment losses on flight equipment and other long-lived assets
used in operations when events and circumstances indicate the assets may be impaired and the estimated future cash flows generated by those assets
are less than their carrying amounts. Factors which could cause impairment include, but are not limited to, (1) a decision to permanently remove flight
equipment or other long-lived assets from operations, (2) significant changes in the estimated useful life, (3) significant changes in projected cash
flows, (4) permanent and significant declines in fleet fair values and (5) changes to the regulatory environment. For long-lived assets held for sale, we
discontinue depreciation and record impairment losses when the carrying amount of these assets is greater than the fair value less the cost to sell.
To determine whether impairments exist for aircraft used in operations, we group assets at the fleet-type level (the lowest level for which there are
identifiable cash flows) and then estimate future cash flows based on projections of capacity, passenger mile yield, fuel costs, labor costs and other
relevant factors. If an impairment occurs, the impairment loss recognized is the amount by which the fleet's carrying amount exceeds its estimated fair
value. We estimate aircraft fair values using published sources, appraisals and bids received from third parties, as available.
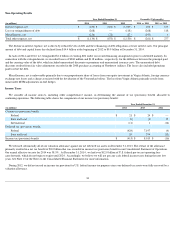
Income Tax Valuation Allowance
We periodically assess whether it is more likely than not that we will generate sufficient taxable income to realize our deferred income tax assets.
We establish valuation allowances if it is not likely we will realize our deferred income tax assets. In making this determination, we consider all
available positive and negative evidence and make certain assumptions. We consider, among other things, projected future taxable income, scheduled
reversals of deferred tax liabilities, the overall business environment, our historical financial results, and tax planning strategies. In evaluating the
likelihood of utilizing our net deferred income tax assets, the significant factors that we consider include (1) our recent history of profitability, (2)
growth in the U.S. and global economies, (3) forecast of airline revenue trends, (4) estimate of future fuel prices and (5) future impact of taxable
temporary differences.
41