Delta Airlines 2014 Annual Report Download - page 31
Download and view the complete annual report
Please find page 31 of the 2014 Delta Airlines annual report below. You can navigate through the pages in the report by either clicking on the pages listed below, or by using the keyword search tool below to find specific information within the annual report.-
 1
1 -
2
-
3
-
4
-
5
-
6
-
7
-
8
-
9
-
10
-
11
-
12
-
13
-
14
-
15
-
16
-
17
-
18
-
19
-
20
-
 21
21 -
 22
22 -
 23
23 -
 24
24 -
 25
25 -
 26
26 -
 27
27 -
 28
28 -
 29
29 -
 30
30 -
 31
31 -
 32
32 -
 33
33 -
 34
34 -
 35
35 -
 36
36 -
 37
37 -
 38
38 -
 39
39 -
 40
40 -
 41
41 -
42
-
43
-
44
-
45
-
46
-
47
-
48
-
49
-
50
-
51
-
52
-
53
-
54
-
55
-
56
-
57
-
58
-
59
-
60
-
61
-
62
-
63
-
64
-
65
-
66
-
67
-
68
-
69
-
70
-
71
-
72
-
73
-
74
-
75
-
76
-
77
-
78
-
79
-
80
-
81
-
82
-
83
-
84
-
85
-
86
-
87
-
88
-
89
-
90
-
91
-
92
-
93
-
94
-
95
-
96
-
97
-
98
-
99
-
100
-
101
-
102
-
103
-
104
-
105
-
106
-
107
-
108
-
109
-
110
-
111
-
112
-
113
-
114
-
115
-
116
-
117
-
118
-
119
-
120
-
121
-
122
-
123
-
124
-
125
-
126
-
127
-
128
-
129
-
130
-
131
-
132
-
133
-
134
-
135
-
136
-
137
-
138
-
139
-
140
-
141
-
142
-
143
-
144
-
145
-
146
-
147
-
148
-
149
-
150
-
151
-
152
-
153
-
154
-
155
-
156
-
157
-
158
-
159
-
160
-
161
-
162
-
163
-
164
-
165
-
166
-
167
-
168
-
169
-
170
-
171
-
172
-
173
-
174
-
175
-
176
-
177
-
178
-
179
-
180
-
181
-
182
-
183
-
184
-
185
-
186
-
187
-
188
-
189
-
190
-
191
-
192
-
193
-
194
-
195
-
196
-
197
-
198
-
199
-
200
-
201
-
202
-
203
-
204
-
205
-
206
-
207
-
208
-
209
-
210
-
211
-
212
-
213
-
214
-
215
-
216
-
217
-
218
-
219
-
220
-
221
-
222
-
223
-
224
-
225
-
226
-
227
-
228
-
229
-
230
-
231
-
232
-
233
-
234
-
235
-
236
-
237
-
238
-
239
-
240
-
241
-
242
-
243
-
244
-
245
-
246
-
247
-
248
-
249
-
250
-
251
-
252
-
253
-
254
-
255
-
256
-
257
-
258
-
259
-
260
-
261
-
262
-
263
-
264
-
265
-
266
-
267
-
268
-
269
-
270
-
271
-
272
-
273
-
274
-
275
-
276
-
277
-
278
-
279
-
280
-
281
-
282
-
283
-
284
-
285
-
286
-
287
-
288
-
289
-
290
-
291
-
292
-
293
-
294
-
295
-
296
-
297
-
298
-
299
-
300
-
301
-
302
-
303
-
304
-
305
-
306
-
307
-
308
-
309
-
310
-
311
-
312
-
313
-
314
-
315
-
316
-
317
-
318
-
319
-
320
-
321
-
322
-
323
-
324
-
325
-
326
-
327
-
328
-
329
-
330
-
331
-
332
-
333
-
334
-
335
-
336
-
337
-
338
-
339
-
340
-
341
-
342
-
343
-
344
-
345
-
346
-
347
-
348
-
349
-
350
-
351
-
352
-
353
-
354
-
355
-
356
-
357
-
358
-
359
-
360
-
361
-
362
-
363
-
364
-
365
-
366
-
367
-
368
-
369
-
370
-
371
-
372
-
373
-
374
-
375
-
376
-
377
-
378
-
379
-
380
-
381
-
382
-
383
-
384
-
385
-
386
-
387
-
388
-
389
-
390
-
391
-
392
-
393
-
394
-
395
-
396
-
397
-
398
-
399
-
400
-
401
-
402
-
403
-
404
-
405
-
406
-
407
-
408
-
409
-
410
-
411
-
412
-
413
-
414
-
415
-
416
-
417
-
418
-
419
-
420
-
421
-
422
-
423
-
424
-
425
-
426
-
427
-
428
-
429
-
430
-
431
-
432
-
433
-
434
-
435
-
436
-
437
-
438
-
439
-
440
-
441
-
442
-
443
-
444
-
445
-
446
-
447
-
448
-
449
-
450
-
451
-
452
-
453
-
454
-
455
-
456
 |
 |

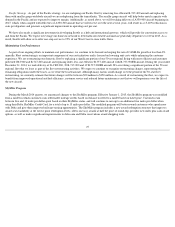
ITEM 7. MANAGEMENT'S DISCUSSION AND ANALYSIS OF FINANCIAL CONDITION AND RESULTS OF OPERATIONS
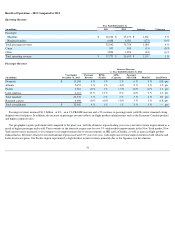
Financial Highlights - 2014 Compared to 2013
Our pre-tax income for 2014 was $ 1.1 billion , representing a $ 1.5 billion decrease compared to prior year as a result of $3.5 billion of special
items. Excluding special items, pre-tax income increased $1.9 billion, or 70%, to $4.5 billion primarily driven by higher passenger revenue, lower fuel
prices and flat non-fuel unit cost growth.
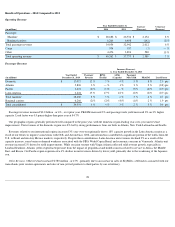
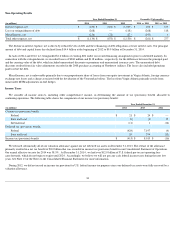
Revenue. Our passenger revenue increased $ 2.0 billion , or 6%, compared to prior year due to a 2% increase in passenger mile yield on 4% higher
traffic. Passenger revenue per available seat mile ("PRASM") increased 3% on 3% higher capacity. Our ability to maintain revenue momentum was
driven by a strong domestic demand environment, higher corporate sales and merchandising initiatives.
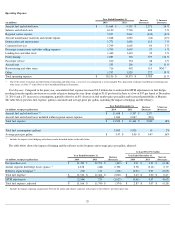
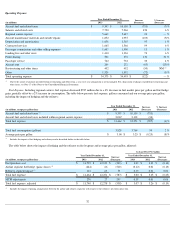
Operating Expense. Total operating expense increased $3.8 billion from 2013 driven by the special items noted above and discussed below. Our
consolidated operating cost per available seat mile ("CASM") for 2014 increased 8% to 15.92 cent s from 14.77 cent s in 2013 , on a 3% increase in
capacity. Non-fuel unit costs ("CASM-Ex," a non-GAAP financial measure) increased 0.2% to 9.16 cent s in 2014 compared to 2013 .
The increase in total operating expense is primarily due to special items recorded during the year, including $2.3 billion related to unfavorable
MTM adjustments on fuel hedges and $716 million of restructuring and other, primarily associated with our fleet restructuring initiatives. The MTM
adjustments are based on market prices at the end of the reporting period for contracts settling in future periods and were driven by the significant
decrease in crude oil prices during the year (from a high of $115 per barrel in June to a low of $57 per barrel at December 31, 2014 ). Such market
prices are not necessarily indicative of the actual future value of the underlying hedge in the contract settlement period. The fleet restructuring
initiatives relate to (1) the early retirement of B-747-400 aircraft associated with our ongoing optimization of the Pacific network and (2) the
restructuring of our domestic fleet by replacing a significant portion of our 50-seat regional flying with more efficient and customer preferred CRJ-
900
and B-717-200 aircraft and replacing older, less cost effective B-757-200 aircraft with B-737-900ER aircraft.
The increase in our total operating expense also reflects higher profit sharing, higher salaries and related costs and volume-based cost increases
driven by the increase in capacity. These increases were partially offset by a reduction in regional carrier expense, primarily related to lower fuel costs.
Salaries and related costs are higher primarily due to employee investments.
The non-GAAP financial measures for pre-tax income, adjusted for special items, and CASM-Ex used in this section are defined and reconciled in
"Supplemental Information" below.
Company Initiatives
Network Strategy
We are implementing several strategies that are designed to strengthen and expand our global network and presence. These primarily include our
investment in and joint venture with Virgin Atlantic and efforts to optimize the Pacific network. In support of these strategies, in the December 2014
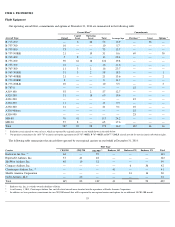
quarter, we announced our order for 50 new widebody aircraft for delivery beginning in 2017 consisting of 25 A330-900neo aircraft, which will
mainly be deployed across the Atlantic, and 25 A350-900 aircraft, which will primarily serve the Pacific region.
Virgin Atlantic Investment. We own a non-controlling 49% equity stake in Virgin Atlantic Limited, the parent company of Virgin Atlantic
Airways . We also have a transatlantic joint venture with Virgin Atlantic Airways with respect to operations on non-stop routes between the United
Kingdom and North America, for which we have antitrust immunity. The relationship allows for joint marketing and sales, coordinated pricing and
revenue management, network planning and scheduling. Virgin Atlantic has a significant presence at London's Heathrow airport, the airport of choice
for business customers traveling to and from London. Along with our state of the art facility at JFK, our relationship with Virgin Atlantic has provided
our customers with superior service and connectivity between New York and London. We expect our joint venture with Virgin Atlantic to increase
capacity between the U.S. and United Kingdom by approximately 10% to 39 peak daily round trips in 2015. This reflects a substantial increase from
the minimal presence we had to the United Kingdom five years ago.
26