Delta Airlines 2014 Annual Report Download - page 72
Download and view the complete annual report
Please find page 72 of the 2014 Delta Airlines annual report below. You can navigate through the pages in the report by either clicking on the pages listed below, or by using the keyword search tool below to find specific information within the annual report.-
 1
1 -
2
-
3
-
4
-
5
-
6
-
7
-
8
-
9
-
10
-
11
-
12
-
13
-
14
-
15
-
16
-
17
-
18
-
19
-
20
-
21
-
22
-
23
-
24
-
25
-
26
-
27
-
28
-
29
-
30
-
31
-
32
-
33
-
34
-
35
-
36
-
37
-
38
-
39
-
40
-
41
-
42
-
43
-
44
-
45
-
46
-
47
-
48
-
49
-
50
-
51
-
52
-
53
-
54
-
55
-
56
-
57
-
58
-
59
-
60
-
61
-
 62
62 -
 63
63 -
 64
64 -
 65
65 -
 66
66 -
 67
67 -
 68
68 -
 69
69 -
 70
70 -
 71
71 -
 72
72 -
 73
73 -
 74
74 -
 75
75 -
 76
76 -
 77
77 -
 78
78 -
 79
79 -
 80
80 -
 81
81 -
 82
82 -
83
-
84
-
85
-
86
-
87
-
88
-
89
-
90
-
91
-
92
-
93
-
94
-
95
-
96
-
97
-
98
-
99
-
100
-
101
-
102
-
103
-
104
-
105
-
106
-
107
-
108
-
109
-
110
-
111
-
112
-
113
-
114
-
115
-
116
-
117
-
118
-
119
-
120
-
121
-
122
-
123
-
124
-
125
-
126
-
127
-
128
-
129
-
130
-
131
-
132
-
133
-
134
-
135
-
136
-
137
-
138
-
139
-
140
-
141
-
142
-
143
-
144
-
145
-
146
-
147
-
148
-
149
-
150
-
151
-
152
-
153
-
154
-
155
-
156
-
157
-
158
-
159
-
160
-
161
-
162
-
163
-
164
-
165
-
166
-
167
-
168
-
169
-
170
-
171
-
172
-
173
-
174
-
175
-
176
-
177
-
178
-
179
-
180
-
181
-
182
-
183
-
184
-
185
-
186
-
187
-
188
-
189
-
190
-
191
-
192
-
193
-
194
-
195
-
196
-
197
-
198
-
199
-
200
-
201
-
202
-
203
-
204
-
205
-
206
-
207
-
208
-
209
-
210
-
211
-
212
-
213
-
214
-
215
-
216
-
217
-
218
-
219
-
220
-
221
-
222
-
223
-
224
-
225
-
226
-
227
-
228
-
229
-
230
-
231
-
232
-
233
-
234
-
235
-
236
-
237
-
238
-
239
-
240
-
241
-
242
-
243
-
244
-
245
-
246
-
247
-
248
-
249
-
250
-
251
-
252
-
253
-
254
-
255
-
256
-
257
-
258
-
259
-
260
-
261
-
262
-
263
-
264
-
265
-
266
-
267
-
268
-
269
-
270
-
271
-
272
-
273
-
274
-
275
-
276
-
277
-
278
-
279
-
280
-
281
-
282
-
283
-
284
-
285
-
286
-
287
-
288
-
289
-
290
-
291
-
292
-
293
-
294
-
295
-
296
-
297
-
298
-
299
-
300
-
301
-
302
-
303
-
304
-
305
-
306
-
307
-
308
-
309
-
310
-
311
-
312
-
313
-
314
-
315
-
316
-
317
-
318
-
319
-
320
-
321
-
322
-
323
-
324
-
325
-
326
-
327
-
328
-
329
-
330
-
331
-
332
-
333
-
334
-
335
-
336
-
337
-
338
-
339
-
340
-
341
-
342
-
343
-
344
-
345
-
346
-
347
-
348
-
349
-
350
-
351
-
352
-
353
-
354
-
355
-
356
-
357
-
358
-
359
-
360
-
361
-
362
-
363
-
364
-
365
-
366
-
367
-
368
-
369
-
370
-
371
-
372
-
373
-
374
-
375
-
376
-
377
-
378
-
379
-
380
-
381
-
382
-
383
-
384
-
385
-
386
-
387
-
388
-
389
-
390
-
391
-
392
-
393
-
394
-
395
-
396
-
397
-
398
-
399
-
400
-
401
-
402
-
403
-
404
-
405
-
406
-
407
-
408
-
409
-
410
-
411
-
412
-
413
-
414
-
415
-
416
-
417
-
418
-
419
-
420
-
421
-
422
-
423
-
424
-
425
-
426
-
427
-
428
-
429
-
430
-
431
-
432
-
433
-
434
-
435
-
436
-
437
-
438
-
439
-
440
-
441
-
442
-
443
-
444
-
445
-
446
-
447
-
448
-
449
-
450
-
451
-
452
-
453
-
454
-
455
-
456
 |
 |
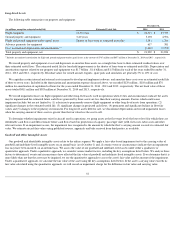
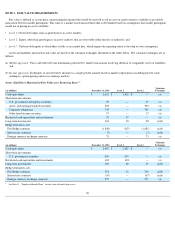
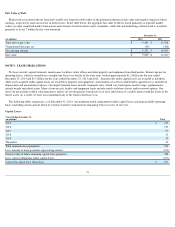
Segment Reporting
Segment results are prepared based on our internal accounting methods described below, with reconciliations to consolidated amounts in
accordance with GAAP. Our segments are not designed to measure operating income or loss directly related to the products and services included in
each segment on a stand-alone basis.
65
(in millions) Airline Refinery Intersegment
Sales/Other Consolidated
Year Ended December 31, 2014
Operating revenue:
$
40,217
$
6,959
$
40,362
Sales to airline segment
$
(1,313
)
(1)
Exchanged products
(5,104
)
(2)
Sales of refined products to third parties
(397
)
(3)
Operating income
(4)
2,110
96
2,206
Interest expense, net
650
—
650
Depreciation and amortization
1,745
26
1,771
Total assets, end of period
53,012
1,109
54,121
Capital expenditures
2,184
65
2,249
Year Ended December 31, 2013
Operating revenue:
$
37,773
$
7,003
$
37,773
Sales to airline segment
$
(1,156
)
(1)
Exchanged products
(5,352
)
(2)
Sales of refined products to third parties
(495
)
(3)
Operating income (loss)
(4)
3,516
(116
)
3,400
Interest expense, net
852
—
852
Depreciation and amortization
1,641
17
1,658
Total assets, end of period
51,080
1,172
52,252
Capital expenditures
2,516
52
2,568
Year Ended December 31, 2012
Operating revenue:
$
36,670
$
1,347
$
36,670
Sales to airline segment
$
(213
)
(1)
Exchanged products
(1,121
)
(2)
Sales of refined products to third parties
(13
)
(3)
Operating income (loss)
(4)
2,238
(63
)
2,175
Interest expense, net
1,005
—
1,005
Depreciation and amortization
1,561
4
1,565
Total assets, end of period
43,386
1,164
44,550
Capital expenditures
1,637
331
1,968
(1)
Represents transfers, valued on a market price basis, from the refinery to the airline segment for use in airline operations. We determine market price by reference to the market index
for the primary delivery location, which is New York Harbor, for jet fuel from the refinery.
(2)
Represents value of products delivered under our strategic agreements, as discussed above, determined on a market price basis.
(3)
Represents sales of refined products to third parties. These sales were at or near cost; accordingly, the margin on these sales is de minimis.
(4)
Includes the impact of pricing arrangements between the airline segment and refinery segment with respect to the refinery's inventory price risk.