Delta Airlines 2014 Annual Report Download - page 29
Download and view the complete annual report
Please find page 29 of the 2014 Delta Airlines annual report below. You can navigate through the pages in the report by either clicking on the pages listed below, or by using the keyword search tool below to find specific information within the annual report.-
 1
1 -
2
-
3
-
4
-
5
-
6
-
7
-
8
-
9
-
10
-
11
-
12
-
13
-
14
-
15
-
16
-
17
-
18
-
 19
19 -
 20
20 -
 21
21 -
 22
22 -
 23
23 -
 24
24 -
 25
25 -
 26
26 -
 27
27 -
 28
28 -
 29
29 -
 30
30 -
 31
31 -
 32
32 -
 33
33 -
 34
34 -
 35
35 -
 36
36 -
 37
37 -
 38
38 -
 39
39 -
40
-
41
-
42
-
43
-
44
-
45
-
46
-
47
-
48
-
49
-
50
-
51
-
52
-
53
-
54
-
55
-
56
-
57
-
58
-
59
-
60
-
61
-
62
-
63
-
64
-
65
-
66
-
67
-
68
-
69
-
70
-
71
-
72
-
73
-
74
-
75
-
76
-
77
-
78
-
79
-
80
-
81
-
82
-
83
-
84
-
85
-
86
-
87
-
88
-
89
-
90
-
91
-
92
-
93
-
94
-
95
-
96
-
97
-
98
-
99
-
100
-
101
-
102
-
103
-
104
-
105
-
106
-
107
-
108
-
109
-
110
-
111
-
112
-
113
-
114
-
115
-
116
-
117
-
118
-
119
-
120
-
121
-
122
-
123
-
124
-
125
-
126
-
127
-
128
-
129
-
130
-
131
-
132
-
133
-
134
-
135
-
136
-
137
-
138
-
139
-
140
-
141
-
142
-
143
-
144
-
145
-
146
-
147
-
148
-
149
-
150
-
151
-
152
-
153
-
154
-
155
-
156
-
157
-
158
-
159
-
160
-
161
-
162
-
163
-
164
-
165
-
166
-
167
-
168
-
169
-
170
-
171
-
172
-
173
-
174
-
175
-
176
-
177
-
178
-
179
-
180
-
181
-
182
-
183
-
184
-
185
-
186
-
187
-
188
-
189
-
190
-
191
-
192
-
193
-
194
-
195
-
196
-
197
-
198
-
199
-
200
-
201
-
202
-
203
-
204
-
205
-
206
-
207
-
208
-
209
-
210
-
211
-
212
-
213
-
214
-
215
-
216
-
217
-
218
-
219
-
220
-
221
-
222
-
223
-
224
-
225
-
226
-
227
-
228
-
229
-
230
-
231
-
232
-
233
-
234
-
235
-
236
-
237
-
238
-
239
-
240
-
241
-
242
-
243
-
244
-
245
-
246
-
247
-
248
-
249
-
250
-
251
-
252
-
253
-
254
-
255
-
256
-
257
-
258
-
259
-
260
-
261
-
262
-
263
-
264
-
265
-
266
-
267
-
268
-
269
-
270
-
271
-
272
-
273
-
274
-
275
-
276
-
277
-
278
-
279
-
280
-
281
-
282
-
283
-
284
-
285
-
286
-
287
-
288
-
289
-
290
-
291
-
292
-
293
-
294
-
295
-
296
-
297
-
298
-
299
-
300
-
301
-
302
-
303
-
304
-
305
-
306
-
307
-
308
-
309
-
310
-
311
-
312
-
313
-
314
-
315
-
316
-
317
-
318
-
319
-
320
-
321
-
322
-
323
-
324
-
325
-
326
-
327
-
328
-
329
-
330
-
331
-
332
-
333
-
334
-
335
-
336
-
337
-
338
-
339
-
340
-
341
-
342
-
343
-
344
-
345
-
346
-
347
-
348
-
349
-
350
-
351
-
352
-
353
-
354
-
355
-
356
-
357
-
358
-
359
-
360
-
361
-
362
-
363
-
364
-
365
-
366
-
367
-
368
-
369
-
370
-
371
-
372
-
373
-
374
-
375
-
376
-
377
-
378
-
379
-
380
-
381
-
382
-
383
-
384
-
385
-
386
-
387
-
388
-
389
-
390
-
391
-
392
-
393
-
394
-
395
-
396
-
397
-
398
-
399
-
400
-
401
-
402
-
403
-
404
-
405
-
406
-
407
-
408
-
409
-
410
-
411
-
412
-
413
-
414
-
415
-
416
-
417
-
418
-
419
-
420
-
421
-
422
-
423
-
424
-
425
-
426
-
427
-
428
-
429
-
430
-
431
-
432
-
433
-
434
-
435
-
436
-
437
-
438
-
439
-
440
-
441
-
442
-
443
-
444
-
445
-
446
-
447
-
448
-
449
-
450
-
451
-
452
-
453
-
454
-
455
-
456
 |
 |

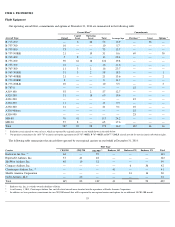
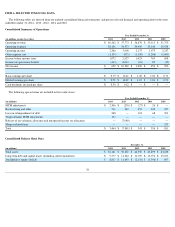
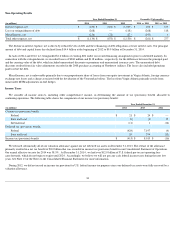
ITEM 6. SELECTED FINANCIAL DATA
The following tables are derived from our audited consolidated financial statements, and present selected financial and operating data for the years
ended December 31, 2014 , 2013 , 2012 , 2011 and 2010 .
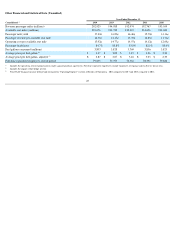
Consolidated Summary of Operations
The following special items are included in the results above:
Consolidated Balance Sheet Data
24
Year Ended December 31,
(in millions, except share data) 2014 2013 2012 2011 2010
Operating revenue
$
40,362
$
37,773
$
36,670
$
35,115
$
31,755
Operating expense
38,156
34,373
34,495
33,140
29,538
Operating income
2,206
3,400
2,175
1,975
2,217
Other expense, net
(1,134
)
(873
)
(1,150
)
(1,206
)
(1,609
)
Income before income taxes
1,072
2,527
1,025
769
608
Income tax (provision) benefit
(413
)
8,013
(16
)
85
(15
)
Net income
$
659
$
10,540
$
1,009
$
854
$
593
Basic earnings per share
$
0.79
$
12.41
$
1.20
$
1.02
$
0.71
Diluted earnings per share
$
0.78
$
12.29
$
1.19
$
1.01
$
0.70
Cash dividends declared per share
$
0.30
$
0.12
$
—
$
—
$
—
Year Ended December 31,
(in millions) 2014 2013 2012 2011 2010
MTM adjustments
$
2,346
$
(276
)
$
(27
)
$
26
$
—
Restructuring and other
716
424
452
242
227
Loss on extinguishment of debt
268
—
118
68
391
Virgin Atlantic MTM adjustments
134
—
—
—
—
Release of tax valuation allowance and intraperiod income tax allocation
—
(
7,989
)
—
—
—
Merger-related items
—
—
—
—
233
Total
$
3,464
$
(7,841
)
$
543
$
336
$
851
December 31,
(in millions) 2014 2013 2012 2011 2010
Total assets
$
54,121
$
52,252
$
44,550
$
43,499
$
43,188
Long-term debt and capital leases (including current maturities)
$
9,777
$
11,342
$
12,709
$
13,791
$
15,252
Stockholders' equity (deficit)
$
8,813
$
11,643
$
(2,131
)
$
(1,396
)
$
897