Delta Airlines 2014 Annual Report Download - page 87
Download and view the complete annual report
Please find page 87 of the 2014 Delta Airlines annual report below. You can navigate through the pages in the report by either clicking on the pages listed below, or by using the keyword search tool below to find specific information within the annual report.-
 1
1 -
2
-
3
-
4
-
5
-
6
-
7
-
8
-
9
-
10
-
11
-
12
-
13
-
14
-
15
-
16
-
17
-
18
-
19
-
20
-
21
-
22
-
23
-
24
-
25
-
26
-
27
-
28
-
29
-
30
-
31
-
32
-
33
-
34
-
35
-
36
-
37
-
38
-
39
-
40
-
41
-
42
-
43
-
44
-
45
-
46
-
47
-
48
-
49
-
50
-
51
-
52
-
53
-
54
-
55
-
56
-
57
-
58
-
59
-
60
-
61
-
62
-
63
-
64
-
65
-
66
-
67
-
68
-
69
-
70
-
71
-
72
-
73
-
74
-
75
-
76
-
 77
77 -
 78
78 -
 79
79 -
 80
80 -
 81
81 -
 82
82 -
 83
83 -
 84
84 -
 85
85 -
 86
86 -
 87
87 -
 88
88 -
 89
89 -
 90
90 -
 91
91 -
 92
92 -
 93
93 -
 94
94 -
 95
95 -
 96
96 -
 97
97 -
98
-
99
-
100
-
101
-
102
-
103
-
104
-
105
-
106
-
107
-
108
-
109
-
110
-
111
-
112
-
113
-
114
-
115
-
116
-
117
-
118
-
119
-
120
-
121
-
122
-
123
-
124
-
125
-
126
-
127
-
128
-
129
-
130
-
131
-
132
-
133
-
134
-
135
-
136
-
137
-
138
-
139
-
140
-
141
-
142
-
143
-
144
-
145
-
146
-
147
-
148
-
149
-
150
-
151
-
152
-
153
-
154
-
155
-
156
-
157
-
158
-
159
-
160
-
161
-
162
-
163
-
164
-
165
-
166
-
167
-
168
-
169
-
170
-
171
-
172
-
173
-
174
-
175
-
176
-
177
-
178
-
179
-
180
-
181
-
182
-
183
-
184
-
185
-
186
-
187
-
188
-
189
-
190
-
191
-
192
-
193
-
194
-
195
-
196
-
197
-
198
-
199
-
200
-
201
-
202
-
203
-
204
-
205
-
206
-
207
-
208
-
209
-
210
-
211
-
212
-
213
-
214
-
215
-
216
-
217
-
218
-
219
-
220
-
221
-
222
-
223
-
224
-
225
-
226
-
227
-
228
-
229
-
230
-
231
-
232
-
233
-
234
-
235
-
236
-
237
-
238
-
239
-
240
-
241
-
242
-
243
-
244
-
245
-
246
-
247
-
248
-
249
-
250
-
251
-
252
-
253
-
254
-
255
-
256
-
257
-
258
-
259
-
260
-
261
-
262
-
263
-
264
-
265
-
266
-
267
-
268
-
269
-
270
-
271
-
272
-
273
-
274
-
275
-
276
-
277
-
278
-
279
-
280
-
281
-
282
-
283
-
284
-
285
-
286
-
287
-
288
-
289
-
290
-
291
-
292
-
293
-
294
-
295
-
296
-
297
-
298
-
299
-
300
-
301
-
302
-
303
-
304
-
305
-
306
-
307
-
308
-
309
-
310
-
311
-
312
-
313
-
314
-
315
-
316
-
317
-
318
-
319
-
320
-
321
-
322
-
323
-
324
-
325
-
326
-
327
-
328
-
329
-
330
-
331
-
332
-
333
-
334
-
335
-
336
-
337
-
338
-
339
-
340
-
341
-
342
-
343
-
344
-
345
-
346
-
347
-
348
-
349
-
350
-
351
-
352
-
353
-
354
-
355
-
356
-
357
-
358
-
359
-
360
-
361
-
362
-
363
-
364
-
365
-
366
-
367
-
368
-
369
-
370
-
371
-
372
-
373
-
374
-
375
-
376
-
377
-
378
-
379
-
380
-
381
-
382
-
383
-
384
-
385
-
386
-
387
-
388
-
389
-
390
-
391
-
392
-
393
-
394
-
395
-
396
-
397
-
398
-
399
-
400
-
401
-
402
-
403
-
404
-
405
-
406
-
407
-
408
-
409
-
410
-
411
-
412
-
413
-
414
-
415
-
416
-
417
-
418
-
419
-
420
-
421
-
422
-
423
-
424
-
425
-
426
-
427
-
428
-
429
-
430
-
431
-
432
-
433
-
434
-
435
-
436
-
437
-
438
-
439
-
440
-
441
-
442
-
443
-
444
-
445
-
446
-
447
-
448
-
449
-
450
-
451
-
452
-
453
-
454
-
455
-
456
 |
 |

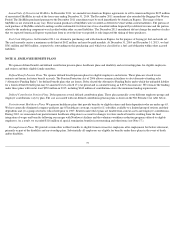
Expected Long-Term Rate of Return. Our expected long-term rate of return on plan assets is based primarily on plan-specific investment studies
using historical market return and volatility data. Modest excess return expectations versus some public market indices are incorporated into the return
projections based on the actively managed structure of the investment programs and their records of achieving such returns historically. We also expect
to receive a premium for investing in less liquid private markets. We review our rate of return on plan asset assumptions annually. Our annual
investment performance for one particular year does not, by itself, significantly influence our evaluation. Our actual historical annualized three and
five year rate of return on plan assets for our defined benefit pension plans was approximately 11% and 9% , respectively, as of December 31, 2014 .
The investment strategy for our defined benefit pension plan assets is to earn a long-term return that meets or exceeds our annualized return target
while taking an acceptable level of risk and maintaining sufficient liquidity to pay current benefits and other cash obligations of the plan. This is
achieved by investing in a globally diversified mix of public and private equity, fixed income, real assets, hedge funds, and other assets and
instruments. Our expected long-term rate of return on assets for net periodic pension benefit cost for the year ended December 31, 2014 was 9% .
Life Expectancy . We have historically utilized the Society of Actuaries' ("SOA") published mortality data in developing a best estimate of life
expectancy. On October 27, 2014, the SOA published updated mortality tables for U.S. plans and an updated improvement scale, which both reflect
improved longevity. Based on an evaluation of these new tables and our perspective of future longevity, we updated the mortality assumptions for
purposes of measuring pension and other postretirement and postemployment benefit obligations at December 31, 2014 . The improvement in life
expectancy increases our benefit obligations and future expense as benefit payments are paid over an extended period of time.
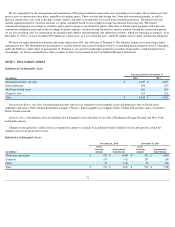
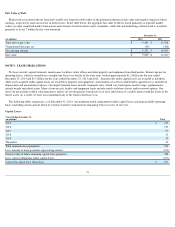
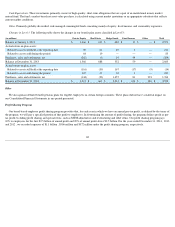
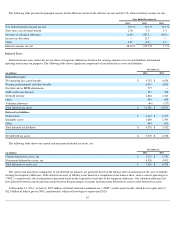
Benefit Payments
Benefit payments in the table below are based on the same assumptions used to measure the related benefit obligations. Actual benefit payments
may vary significantly from these estimates. Benefits earned under our pension plans and certain postemployment benefit plans are expected to be paid
from funded benefit plan trusts, while our other postretirement benefits are funded from current assets.
The following table summarizes, the benefit payments that are scheduled to be paid in the years ending December 31:
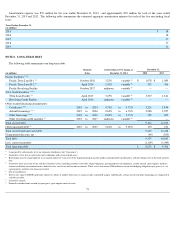
Plan Assets
We have adopted and implemented investment policies for our defined benefit pension plans that incorporate strategic asset allocation mixes
intended to best meet the plans’ long-term obligations, while maintaining an appropriate level of risk and liquidity. These asset portfolios employ a
diversified mix of investments, which are reviewed periodically. Active management strategies are utilized where feasible in an effort to realize
investment returns in excess of market indices. Derivatives in the plans are primarily used to manage risk and gain asset class exposure while still
maintaining liquidity. As part of these strategies, the plans are required to hold cash collateral associated with certain derivative investments, thus
increasing the value of cash equivalents held at December 31, 2014 when compared to December 31, 2013. Investment strategies target a mix of 40 -
50% growth-seeking assets, 20 - 30% income-generating assets and 25 - 30% risk-diversifying assets. Risk diversifying assets include hedged
mandates implementing long-short, market neutral and relative value strategies that invest primarily in publicly-traded equity, fixed income, foreign
currency and commodity securities and derivatives. Delta has increased the allocation to risk-diversifying strategies to improve the impact of active
management on the plans.
80
(in millions) Pension Benefits Other Postretirement and
Postemployment Benefits
2015
$
1,124
$
278
2016
1,133
272
2017
1,153
265
2018
1,173
256
2019
1,191
257
2020-2024
6,229
1,305