Delta Airlines 2014 Annual Report Download - page 439
Download and view the complete annual report
Please find page 439 of the 2014 Delta Airlines annual report below. You can navigate through the pages in the report by either clicking on the pages listed below, or by using the keyword search tool below to find specific information within the annual report.-
 1
1 -
2
-
3
-
4
-
5
-
6
-
7
-
8
-
9
-
10
-
11
-
12
-
13
-
14
-
15
-
16
-
17
-
18
-
19
-
20
-
21
-
22
-
23
-
24
-
25
-
26
-
27
-
28
-
29
-
30
-
31
-
32
-
33
-
34
-
35
-
36
-
37
-
38
-
39
-
40
-
41
-
42
-
43
-
44
-
45
-
46
-
47
-
48
-
49
-
50
-
51
-
52
-
53
-
54
-
55
-
56
-
57
-
58
-
59
-
60
-
61
-
62
-
63
-
64
-
65
-
66
-
67
-
68
-
69
-
70
-
71
-
72
-
73
-
74
-
75
-
76
-
77
-
78
-
79
-
80
-
81
-
82
-
83
-
84
-
85
-
86
-
87
-
88
-
89
-
90
-
91
-
92
-
93
-
94
-
95
-
96
-
97
-
98
-
99
-
100
-
101
-
102
-
103
-
104
-
105
-
106
-
107
-
108
-
109
-
110
-
111
-
112
-
113
-
114
-
115
-
116
-
117
-
118
-
119
-
120
-
121
-
122
-
123
-
124
-
125
-
126
-
127
-
128
-
129
-
130
-
131
-
132
-
133
-
134
-
135
-
136
-
137
-
138
-
139
-
140
-
141
-
142
-
143
-
144
-
145
-
146
-
147
-
148
-
149
-
150
-
151
-
152
-
153
-
154
-
155
-
156
-
157
-
158
-
159
-
160
-
161
-
162
-
163
-
164
-
165
-
166
-
167
-
168
-
169
-
170
-
171
-
172
-
173
-
174
-
175
-
176
-
177
-
178
-
179
-
180
-
181
-
182
-
183
-
184
-
185
-
186
-
187
-
188
-
189
-
190
-
191
-
192
-
193
-
194
-
195
-
196
-
197
-
198
-
199
-
200
-
201
-
202
-
203
-
204
-
205
-
206
-
207
-
208
-
209
-
210
-
211
-
212
-
213
-
214
-
215
-
216
-
217
-
218
-
219
-
220
-
221
-
222
-
223
-
224
-
225
-
226
-
227
-
228
-
229
-
230
-
231
-
232
-
233
-
234
-
235
-
236
-
237
-
238
-
239
-
240
-
241
-
242
-
243
-
244
-
245
-
246
-
247
-
248
-
249
-
250
-
251
-
252
-
253
-
254
-
255
-
256
-
257
-
258
-
259
-
260
-
261
-
262
-
263
-
264
-
265
-
266
-
267
-
268
-
269
-
270
-
271
-
272
-
273
-
274
-
275
-
276
-
277
-
278
-
279
-
280
-
281
-
282
-
283
-
284
-
285
-
286
-
287
-
288
-
289
-
290
-
291
-
292
-
293
-
294
-
295
-
296
-
297
-
298
-
299
-
300
-
301
-
302
-
303
-
304
-
305
-
306
-
307
-
308
-
309
-
310
-
311
-
312
-
313
-
314
-
315
-
316
-
317
-
318
-
319
-
320
-
321
-
322
-
323
-
324
-
325
-
326
-
327
-
328
-
329
-
330
-
331
-
332
-
333
-
334
-
335
-
336
-
337
-
338
-
339
-
340
-
341
-
342
-
343
-
344
-
345
-
346
-
347
-
348
-
349
-
350
-
351
-
352
-
353
-
354
-
355
-
356
-
357
-
358
-
359
-
360
-
361
-
362
-
363
-
364
-
365
-
366
-
367
-
368
-
369
-
370
-
371
-
372
-
373
-
374
-
375
-
376
-
377
-
378
-
379
-
380
-
381
-
382
-
383
-
384
-
385
-
386
-
387
-
388
-
389
-
390
-
391
-
392
-
393
-
394
-
395
-
396
-
397
-
398
-
399
-
400
-
401
-
402
-
403
-
404
-
405
-
406
-
407
-
408
-
409
-
410
-
411
-
412
-
413
-
414
-
415
-
416
-
417
-
418
-
419
-
420
-
421
-
422
-
423
-
424
-
425
-
426
-
427
-
428
-
 429
429 -
 430
430 -
 431
431 -
 432
432 -
 433
433 -
 434
434 -
 435
435 -
 436
436 -
 437
437 -
 438
438 -
 439
439 -
 440
440 -
 441
441 -
 442
442 -
 443
443 -
 444
444 -
 445
445 -
 446
446 -
 447
447 -
 448
448 -
 449
449 -
450
-
451
-
452
-
453
-
454
-
455
-
456
 |
 |

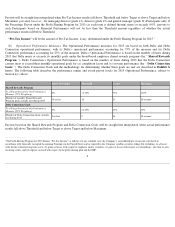
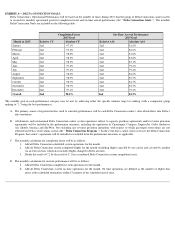
6. The Performance Measures—Threshold, Target and Maximum Payout Levels.
The Target MIP Award, and the amounts paid in
connection with target levels of Financial, Operational, Revenue, Leadership Effectiveness, and Individual Performance, are based on the
achievement of the target performance level with respect to each applicable performance measure (except that Financial Performance
also requires a payout under the Profit Sharing Program for 2015). A Participant’
s actual MIP Award may be greater or less than the
target amount based on whether performance under one or more of the performance measures applicable to the Participant exceeds or is
below target performance, subject to Section 4(c) above. This is explained in more detail below.
(a) Financial Performance Measures . The Financial Performance measures for 2015 are based on Delta’s Pre-
Tax Income, as
defined below. The following table describes the performance ranges and award payout levels for 2015 Financial Performance, subject to
Section 4(c) above:
3
Performance Measures and Weightings
Employment
Level
% of Target MIP
Award allocated to
Financial
Performance
% of Target MIP
Award allocated to
Operational
Performance
% of Target MIP Award
Allocated to Revenue
Performance
% of Target MIP Award
allocated to
Leadership
Effectiveness
Performance
% of Target MIP
Award allocated to
Individual
Performance
CEO 50% 25% 25% 0% 0%
President 50% 25% 25% 0% 0%
EVP 50% 25% 25% 0% 0%
CIO and SVP – Supply
Chain Management 50% 25% 25% 0% 0%
SVP 50% 25% 15% 10% 0%
VP 50% 25% 15% 10% 0%
Managing Director
(Grade 13)
35% 15% 10% 0% 40%
Director
(Grade 12)
35% 15% 10% 0% 40%
General Manager
(Grade
11)
25% 15% 10% 0% 50%
Grade 10 0% 0% 0% 0% 100%
Grade 8 0% 0% 0% 0% 100%
Threshold
Target
Maximum
% of Target Financial Performance Measure
Paid
50%
100%
200%
Required 2015 Pre-Tax
Income
$5,089 Million
$6,649 Million $7,360 Million