Delta Airlines 2014 Annual Report Download - page 33
Download and view the complete annual report
Please find page 33 of the 2014 Delta Airlines annual report below. You can navigate through the pages in the report by either clicking on the pages listed below, or by using the keyword search tool below to find specific information within the annual report.-
 1
1 -
2
-
3
-
4
-
5
-
6
-
7
-
8
-
9
-
10
-
11
-
12
-
13
-
14
-
15
-
16
-
17
-
18
-
19
-
20
-
21
-
22
-
 23
23 -
 24
24 -
 25
25 -
 26
26 -
 27
27 -
 28
28 -
 29
29 -
 30
30 -
 31
31 -
 32
32 -
 33
33 -
 34
34 -
 35
35 -
 36
36 -
 37
37 -
 38
38 -
 39
39 -
 40
40 -
 41
41 -
 42
42 -
 43
43 -
44
-
45
-
46
-
47
-
48
-
49
-
50
-
51
-
52
-
53
-
54
-
55
-
56
-
57
-
58
-
59
-
60
-
61
-
62
-
63
-
64
-
65
-
66
-
67
-
68
-
69
-
70
-
71
-
72
-
73
-
74
-
75
-
76
-
77
-
78
-
79
-
80
-
81
-
82
-
83
-
84
-
85
-
86
-
87
-
88
-
89
-
90
-
91
-
92
-
93
-
94
-
95
-
96
-
97
-
98
-
99
-
100
-
101
-
102
-
103
-
104
-
105
-
106
-
107
-
108
-
109
-
110
-
111
-
112
-
113
-
114
-
115
-
116
-
117
-
118
-
119
-
120
-
121
-
122
-
123
-
124
-
125
-
126
-
127
-
128
-
129
-
130
-
131
-
132
-
133
-
134
-
135
-
136
-
137
-
138
-
139
-
140
-
141
-
142
-
143
-
144
-
145
-
146
-
147
-
148
-
149
-
150
-
151
-
152
-
153
-
154
-
155
-
156
-
157
-
158
-
159
-
160
-
161
-
162
-
163
-
164
-
165
-
166
-
167
-
168
-
169
-
170
-
171
-
172
-
173
-
174
-
175
-
176
-
177
-
178
-
179
-
180
-
181
-
182
-
183
-
184
-
185
-
186
-
187
-
188
-
189
-
190
-
191
-
192
-
193
-
194
-
195
-
196
-
197
-
198
-
199
-
200
-
201
-
202
-
203
-
204
-
205
-
206
-
207
-
208
-
209
-
210
-
211
-
212
-
213
-
214
-
215
-
216
-
217
-
218
-
219
-
220
-
221
-
222
-
223
-
224
-
225
-
226
-
227
-
228
-
229
-
230
-
231
-
232
-
233
-
234
-
235
-
236
-
237
-
238
-
239
-
240
-
241
-
242
-
243
-
244
-
245
-
246
-
247
-
248
-
249
-
250
-
251
-
252
-
253
-
254
-
255
-
256
-
257
-
258
-
259
-
260
-
261
-
262
-
263
-
264
-
265
-
266
-
267
-
268
-
269
-
270
-
271
-
272
-
273
-
274
-
275
-
276
-
277
-
278
-
279
-
280
-
281
-
282
-
283
-
284
-
285
-
286
-
287
-
288
-
289
-
290
-
291
-
292
-
293
-
294
-
295
-
296
-
297
-
298
-
299
-
300
-
301
-
302
-
303
-
304
-
305
-
306
-
307
-
308
-
309
-
310
-
311
-
312
-
313
-
314
-
315
-
316
-
317
-
318
-
319
-
320
-
321
-
322
-
323
-
324
-
325
-
326
-
327
-
328
-
329
-
330
-
331
-
332
-
333
-
334
-
335
-
336
-
337
-
338
-
339
-
340
-
341
-
342
-
343
-
344
-
345
-
346
-
347
-
348
-
349
-
350
-
351
-
352
-
353
-
354
-
355
-
356
-
357
-
358
-
359
-
360
-
361
-
362
-
363
-
364
-
365
-
366
-
367
-
368
-
369
-
370
-
371
-
372
-
373
-
374
-
375
-
376
-
377
-
378
-
379
-
380
-
381
-
382
-
383
-
384
-
385
-
386
-
387
-
388
-
389
-
390
-
391
-
392
-
393
-
394
-
395
-
396
-
397
-
398
-
399
-
400
-
401
-
402
-
403
-
404
-
405
-
406
-
407
-
408
-
409
-
410
-
411
-
412
-
413
-
414
-
415
-
416
-
417
-
418
-
419
-
420
-
421
-
422
-
423
-
424
-
425
-
426
-
427
-
428
-
429
-
430
-
431
-
432
-
433
-
434
-
435
-
436
-
437
-
438
-
439
-
440
-
441
-
442
-
443
-
444
-
445
-
446
-
447
-
448
-
449
-
450
-
451
-
452
-
453
-
454
-
455
-
456
 |
 |

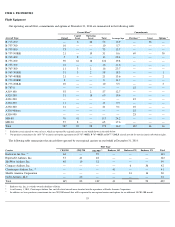
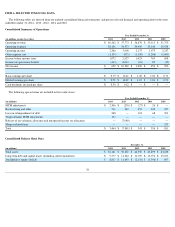
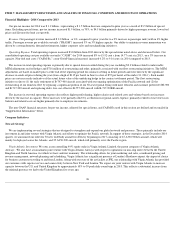
Results of Operations - 2014 Compared to 2013
Operating Revenue
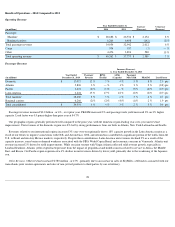
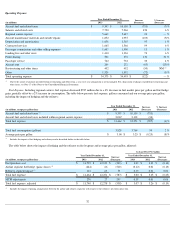
Passenger Revenue
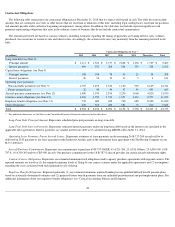
Passenger revenue increased $2.0 billion , or 6% , over prior year. PRASM increased 3% and passenger mile yield increased 2% on 3% higher
capacity. Load factor was 0.9 points higher than prior year at 84.7% .
Our geographic regions generally performed well compared to the prior year, with the domestic region leading year-over-year unit revenue
improvement. Unit revenues of the domestic region rose 8% led by strong performances from our hubs in Atlanta, New York-LaGuardia and Seattle.
Revenues related to our international regions increased 3% year-over-year primarily due to 18% capacity growth in the Latin America region as a
result of our efforts to improve connections with GOL and Aeroméxico. GOL and Aeroméxico contributed a significant portion of the traffic from the
U.S. to Brazil and into key Mexico markets, respectively. Despite these contributions, Latin America unit revenues declined 2% as a result of the
capacity increase, some business demand weakness associated with the FIFA World Cup in Brazil and economic concerns in Venezuela. Atlantic unit
revenue increased 2% driven by yield improvements. While our joint venture with Virgin Atlantic reflected solid revenue growth, especially in
London-Heathrow, Atlantic yields experienced pressure from the impact of geopolitical and health concerns related to service to Africa, the Middle
East, and Russia. Our Pacific region experienced a 4% decline in unit revenues driven by lower yield, primarily due to the weakening of the Japanese
yen.
Other Revenue. Other revenue increased $ 580 million , or 15% , primarily due to an increase in sales of SkyMiles, settlements associated with our
transatlantic joint venture agreements and sales of non-jet fuel products to third parties by our oil refinery.
28
Year Ended December 31, Increase
(Decrease) % Increase
(Decrease) (in millions) 2014 2013
Passenger:
Mainline
$
28,688
$
26,534
$
2,154
8
%
Regional carriers
6,266
6,408
(142
)
(2
)%
Total passenger revenue
34,954
32,942
2,012
6
%
Cargo
934
937
(3
)
—
%
Other
4,474
3,894
580
15
%
Total operating revenue
$
40,362
$
37,773
$
2,589
7
%
Increase (Decrease)
vs. Year Ended December 31, 2013
(in millions) Year Ended
December 31, 2014 Passenger
Revenue RPMs
(Traffic) ASMs
(Capacity) Passenger
Mile Yield PRASM Load Factor
Domestic
$
17,017
12
%
7
%
4
%
5
%
8
%
2.0
pts
Atlantic
5,826
3
%
—
%
1
%
3
%
2
%
(0.8
)
pts
Pacific
3,421
(4
)%
(1
)%
—
%
(
3
)%
(4
)%
(0.9
)
pts
Latin America
2,424
15
%
17
%
18
%
(2
)%
(2
)%
(0.7
)
pts
Total mainline
28,688
8
%
5
%
4
%
3
%
4
%
0.7
pts
Regional carriers
6,266
(2
)%
(2
)%
(4
)%
(1
)%
2
%
1.9
pts
Total consolidated
$
34,954
6
%
4
%
3
%
2
%
3
%
0.9
pts